# GreptimeDB 快速开始
> 10 分钟上手 GreptimeDB——从数据写入到 metrics、logs、traces 跨信号关联查询。
# 快速开始
开始之前,请确保已[安装 GreptimeDB](./installation/overview.md)。
本指南用 SQL 带你体验 GreptimeDB 的核心能力——从数据写入到 metrics、logs、traces 跨信号关联查询。SQL 同时也是 GreptimeDB 的管理入口,用于建表、设置 TTL 策略、配置索引等。
:::tip 已经在用 Prometheus、OpenTelemetry、Loki 或 ES?
可以直接用现有工具写入数据,不需要手动建表(GreptimeDB 会[自动建表](/user-guide/ingest-data/overview.md#自动生成表结构)):
- [Prometheus Remote Write](/user-guide/ingest-data/for-observability/prometheus.md)
- [OpenTelemetry (OTLP)](/user-guide/ingest-data/for-observability/opentelemetry.md)
- [Loki 协议](/user-guide/ingest-data/for-observability/loki.md)
- [Elasticsearch](/user-guide/ingest-data/for-observability/elasticsearch/)
继续阅读本指南,了解数据进来之后能做什么。
:::
**你将学到(10–15 分钟):**
- 连接 GreptimeDB,创建 metrics、logs、traces 表
- 用 SQL 查询和聚合数据
- 全文索引关键词搜索日志
- 用 Range Query 计算时间窗口内的 p95 延迟
- **一条 SQL 关联 metrics、logs 和 traces**
- SQL 和 PromQL 混合查询
## 连接 GreptimeDB
GreptimeDB 支持[多种协议](/user-guide/protocols/overview.md)。本指南使用 SQL。
GreptimeDB 默认运行在 `127.0.0.1`,MySQL 协议端口 `4002`,PostgreSQL 协议端口 `4003`,连接方式:
```shell
mysql -h 127.0.0.1 -P 4002
```
或
```shell
psql -h 127.0.0.1 -p 4003 -d public
```
也可以用浏览器打开内置 Dashboard `http://127.0.0.1:4000/dashboard`,直接运行本指南中的所有 SQL。
默认未开启[认证](/user-guide/deployments-administration/authentication/overview.md),连接时不需要用户名和密码。
## 建表
我们创建三张表模拟一个真实场景:gRPC 延迟指标、应用日志和请求链路。两台服务器 `host1` 和 `host2` 在采集数据,从 `2024-07-11 20:00:10` 开始,`host1` 出现异常。
### Metrics 表
```sql
-- Metrics:gRPC 调用延迟(毫秒)
CREATE TABLE grpc_latencies (
ts TIMESTAMP TIME INDEX,
host STRING,
method_name STRING,
latency DOUBLE,
PRIMARY KEY (host, method_name)
);
```
- `ts`:数据采集时间([时间索引](/user-guide/concepts/data-model.md))。
- `host` 和 `method_name`:[Tag](/user-guide/concepts/data-model.md) 列,标识时间序列。
- `latency`:[Field](/user-guide/concepts/data-model.md) 列,存放实际指标值。
### Logs 表
```sql
-- Logs:应用错误日志
CREATE TABLE app_logs (
ts TIMESTAMP TIME INDEX,
host STRING,
api_path STRING,
log_level STRING,
log_msg STRING FULLTEXT INDEX WITH('case_sensitive' = 'false'),
PRIMARY KEY (host, log_level)
) WITH ('append_mode'='true');
```
- `log_msg` 启用了[全文索引](/user-guide/manage-data/data-index.md#全文索引),支持关键词搜索。
- [`append_mode`](/user-guide/deployments-administration/performance-tuning/design-table.md#何时使用-append-only-表) 针对日志场景优化(无去重开销)。
### Traces 表
```sql
-- Traces:请求链路 Span
CREATE TABLE traces (
ts TIMESTAMP TIME INDEX,
trace_id STRING SKIPPING INDEX,
span_id STRING,
parent_span_id STRING,
service_name STRING,
operation STRING,
duration DOUBLE,
status_code INT,
PRIMARY KEY (service_name)
) WITH ('append_mode'='true');
```
对于高基数的 `trace_id` 我们启用了[跳数索引](/user-guide/manage-data/data-index.md#跳数索引)。
:::tip
这里用 SQL 写入数据,所以需要手动建表。但 GreptimeDB 支持 [Schemaless](/user-guide/ingest-data/overview.md#自动生成表结构)——通过 OpenTelemetry、Prometheus Remote Write、InfluxDB Line Protocol 等协议写入时,表会自动创建。
:::
## 写入数据
插入模拟数据。`20:00:10` 之前两台主机都正常,之后 `host1` 开始出现延迟飙升。
### 正常阶段(20:00:10 之前)
```sql
INSERT INTO grpc_latencies (ts, host, method_name, latency) VALUES
('2024-07-11 20:00:06', 'host1', 'GetUser', 103.0),
('2024-07-11 20:00:06', 'host2', 'GetUser', 113.0),
('2024-07-11 20:00:07', 'host1', 'GetUser', 103.5),
('2024-07-11 20:00:07', 'host2', 'GetUser', 107.0),
('2024-07-11 20:00:08', 'host1', 'GetUser', 104.0),
('2024-07-11 20:00:08', 'host2', 'GetUser', 96.0),
('2024-07-11 20:00:09', 'host1', 'GetUser', 104.5),
('2024-07-11 20:00:09', 'host2', 'GetUser', 114.0);
```
### 异常阶段(20:00:10 之后)
`host1` 延迟开始剧烈波动,偶尔飙到几千毫秒:
点击展开 INSERT 语句
```sql
INSERT INTO grpc_latencies (ts, host, method_name, latency) VALUES
('2024-07-11 20:00:10', 'host1', 'GetUser', 150.0),
('2024-07-11 20:00:10', 'host2', 'GetUser', 110.0),
('2024-07-11 20:00:11', 'host1', 'GetUser', 200.0),
('2024-07-11 20:00:11', 'host2', 'GetUser', 102.0),
('2024-07-11 20:00:12', 'host1', 'GetUser', 1000.0),
('2024-07-11 20:00:12', 'host2', 'GetUser', 108.0),
('2024-07-11 20:00:13', 'host1', 'GetUser', 80.0),
('2024-07-11 20:00:13', 'host2', 'GetUser', 111.0),
('2024-07-11 20:00:14', 'host1', 'GetUser', 4200.0),
('2024-07-11 20:00:14', 'host2', 'GetUser', 95.0),
('2024-07-11 20:00:15', 'host1', 'GetUser', 90.0),
('2024-07-11 20:00:15', 'host2', 'GetUser', 115.0),
('2024-07-11 20:00:16', 'host1', 'GetUser', 3000.0),
('2024-07-11 20:00:16', 'host2', 'GetUser', 95.0),
('2024-07-11 20:00:17', 'host1', 'GetUser', 320.0),
('2024-07-11 20:00:17', 'host2', 'GetUser', 115.0),
('2024-07-11 20:00:18', 'host1', 'GetUser', 3500.0),
('2024-07-11 20:00:18', 'host2', 'GetUser', 95.0),
('2024-07-11 20:00:19', 'host1', 'GetUser', 100.0),
('2024-07-11 20:00:19', 'host2', 'GetUser', 115.0),
('2024-07-11 20:00:20', 'host1', 'GetUser', 2500.0),
('2024-07-11 20:00:20', 'host2', 'GetUser', 95.0);
```
### 异常期间的错误日志
```sql
INSERT INTO app_logs (ts, host, api_path, log_level, log_msg) VALUES
('2024-07-11 20:00:10', 'host1', '/api/v1/resource', 'ERROR', 'Connection timeout'),
('2024-07-11 20:00:10', 'host1', '/api/v1/billings', 'ERROR', 'Connection timeout'),
('2024-07-11 20:00:11', 'host1', '/api/v1/resource', 'ERROR', 'Database unavailable'),
('2024-07-11 20:00:11', 'host1', '/api/v1/billings', 'ERROR', 'Database unavailable'),
('2024-07-11 20:00:12', 'host1', '/api/v1/resource', 'ERROR', 'Service overload'),
('2024-07-11 20:00:12', 'host1', '/api/v1/billings', 'ERROR', 'Service overload'),
('2024-07-11 20:00:13', 'host1', '/api/v1/resource', 'ERROR', 'Connection reset'),
('2024-07-11 20:00:13', 'host1', '/api/v1/billings', 'ERROR', 'Connection reset'),
('2024-07-11 20:00:14', 'host1', '/api/v1/resource', 'ERROR', 'Timeout'),
('2024-07-11 20:00:14', 'host1', '/api/v1/billings', 'ERROR', 'Timeout'),
('2024-07-11 20:00:15', 'host1', '/api/v1/resource', 'ERROR', 'Disk full'),
('2024-07-11 20:00:15', 'host1', '/api/v1/billings', 'ERROR', 'Disk full'),
('2024-07-11 20:00:16', 'host1', '/api/v1/resource', 'ERROR', 'Network issue'),
('2024-07-11 20:00:16', 'host1', '/api/v1/billings', 'ERROR', 'Network issue');
```
### 异常期间的 Trace Span
```sql
INSERT INTO traces (ts, trace_id, span_id, parent_span_id, service_name, operation, duration, status_code) VALUES
('2024-07-11 20:00:12', 'abc123', 'span1', '', 'host1', 'POST /api/v1/resource', 1050.0, 2),
('2024-07-11 20:00:12', 'abc123', 'span2', 'span1', 'host1', 'GetUser', 1000.0, 2),
('2024-07-11 20:00:14', 'def456', 'span3', '', 'host1', 'POST /api/v1/billings', 4250.0, 2),
('2024-07-11 20:00:14', 'def456', 'span4', 'span3', 'host1', 'CreateBilling', 4200.0, 2),
('2024-07-11 20:00:16', 'ghi789', 'span5', '', 'host1', 'POST /api/v1/resource', 3100.0, 2),
('2024-07-11 20:00:16', 'ghi789', 'span6', 'span5', 'host1', 'GetUser', 3000.0, 2),
('2024-07-11 20:00:12', 'jkl012', 'span7', '', 'host2', 'POST /api/v1/resource', 115.0, 0),
('2024-07-11 20:00:12', 'jkl012', 'span8', 'span7', 'host2', 'GetUser', 108.0, 0);
```
## 查询数据
### 按 Tag 和时间过滤
查询 `host1` 在 `2024-07-11 20:00:15` 之后的延迟:
```sql
SELECT *
FROM grpc_latencies
WHERE host = 'host1' AND ts > '2024-07-11 20:00:15';
```
```sql
+---------------------+-------+-------------+---------+
| ts | host | method_name | latency |
+---------------------+-------+-------------+---------+
| 2024-07-11 20:00:16 | host1 | GetUser | 3000 |
| 2024-07-11 20:00:17 | host1 | GetUser | 320 |
| 2024-07-11 20:00:18 | host1 | GetUser | 3500 |
| 2024-07-11 20:00:19 | host1 | GetUser | 100 |
| 2024-07-11 20:00:20 | host1 | GetUser | 2500 |
+---------------------+-------+-------------+---------+
5 rows in set (0.14 sec)
```
按 host 计算 p95 延迟:
```sql
SELECT
host,
approx_percentile_cont(0.95) WITHIN GROUP (ORDER BY latency) AS p95_latency
FROM grpc_latencies
WHERE ts >= '2024-07-11 20:00:10'
GROUP BY host;
```
```sql
+-------+-------------------+
| host | p95_latency |
+-------+-------------------+
| host1 | 4164.999999999999 |
| host2 | 115 |
+-------+-------------------+
2 rows in set (0.11 sec)
```
### 全文搜索日志
`@@` 操作符用于[全文搜索](/user-guide/logs/fulltext-search.md):
```sql
SELECT *
FROM app_logs
WHERE lower(log_msg) @@ 'timeout'
AND ts > '2024-07-11 20:00:00'
ORDER BY ts;
```
```sql
+---------------------+-------+------------------+-----------+--------------------+
| ts | host | api_path | log_level | log_msg |
+---------------------+-------+------------------+-----------+--------------------+
| 2024-07-11 20:00:10 | host1 | /api/v1/billings | ERROR | Connection timeout |
| 2024-07-11 20:00:10 | host1 | /api/v1/resource | ERROR | Connection timeout |
| 2024-07-11 20:00:14 | host1 | /api/v1/billings | ERROR | Timeout |
| 2024-07-11 20:00:14 | host1 | /api/v1/resource | ERROR | Timeout |
+---------------------+-------+------------------+-----------+--------------------+
```
### Range Query
用 [Range Query](/reference/sql/range.md) 计算 5 秒窗口内的 p95 延迟:
```sql
SELECT
ts,
host,
approx_percentile_cont(0.95) WITHIN GROUP (ORDER BY latency)
RANGE '5s' AS p95_latency
FROM grpc_latencies
ALIGN '5s' FILL PREV
ORDER BY host, ts;
```
```sql
+---------------------+-------+-------------+
| ts | host | p95_latency |
+---------------------+-------+-------------+
| 2024-07-11 20:00:05 | host1 | 104.5 |
| 2024-07-11 20:00:10 | host1 | 4200 |
| 2024-07-11 20:00:15 | host1 | 3500 |
| 2024-07-11 20:00:20 | host1 | 2500 |
| 2024-07-11 20:00:05 | host2 | 114 |
| 2024-07-11 20:00:10 | host2 | 111 |
| 2024-07-11 20:00:15 | host2 | 115 |
| 2024-07-11 20:00:20 | host2 | 95 |
+---------------------+-------+-------------+
8 rows in set (0.06 sec)
```
Range Query 是 GreptimeDB 做时间窗口聚合的利器,详见[文档](/reference/sql/range.md)。
### 关联 Metrics、Logs 和 Traces
统一数据库的真正威力在这里。一条查询同时关联 p95 延迟、错误日志数和慢 Trace Span——跨三种信号类型:
```sql
WITH
-- Metrics:按 host 计算 5 秒窗口的 p95 延迟
metrics AS (
SELECT
ts, host,
approx_percentile_cont(0.95) WITHIN GROUP (ORDER BY latency)
RANGE '5s' AS p95_latency
FROM grpc_latencies
ALIGN '5s' FILL PREV
),
-- Logs:按 host 统计 5 秒窗口的 ERROR 数
logs AS (
SELECT
ts, host,
count(log_msg) RANGE '5s' AS num_errors
FROM app_logs
WHERE log_level = 'ERROR'
ALIGN '5s'
),
-- Traces:按 host 统计 5 秒窗口的慢 Span
slow_traces AS (
SELECT
date_bin(INTERVAL '5' seconds, ts) AS ts,
service_name AS host,
COUNT(*) AS slow_spans,
MAX(duration) AS max_span_duration
FROM traces
WHERE duration > 500
GROUP BY date_bin(INTERVAL '5' seconds, ts), service_name
)
SELECT
m.ts,
m.host,
m.p95_latency,
COALESCE(l.num_errors, 0) AS num_errors,
COALESCE(t.slow_spans, 0) AS slow_spans,
t.max_span_duration
FROM metrics m
LEFT JOIN logs l ON m.host = l.host AND m.ts = l.ts
LEFT JOIN slow_traces t ON m.host = t.host AND m.ts = t.ts
ORDER BY m.ts, m.host;
```
```sql
+---------------------+-------+-------------+------------+------------+-------------------+
| ts | host | p95_latency | num_errors | slow_spans | max_span_duration |
+---------------------+-------+-------------+------------+------------+-------------------+
| 2024-07-11 20:00:05 | host1 | 104.5 | 0 | 0 | NULL |
| 2024-07-11 20:00:05 | host2 | 114 | 0 | 0 | NULL |
| 2024-07-11 20:00:10 | host1 | 4200 | 10 | 4 | 4250 |
| 2024-07-11 20:00:10 | host2 | 111 | 0 | 0 | NULL |
| 2024-07-11 20:00:15 | host1 | 3500 | 4 | 2 | 3100 |
| 2024-07-11 20:00:15 | host2 | 115 | 0 | 0 | NULL |
| 2024-07-11 20:00:20 | host1 | 2500 | 0 | 0 | NULL |
| 2024-07-11 20:00:20 | host2 | 95 | 0 | 0 | NULL |
+---------------------+-------+-------------+------------+------------+-------------------+
8 rows in set (0.02 sec)
```
结论很清晰:**`20:00:10` – `20:00:15` 窗口内,`host1` 的 p95 延迟飙到 4200ms,出现 10 条错误日志,4 个慢 Span(最慢 4250ms)。`host2` 全程正常。** 在传统三支柱架构下,这个关联分析需要在 Prometheus、Loki、Jaeger 之间来回切换。用 GreptimeDB,一条查询搞定。
### 用 PromQL 查询
GreptimeDB 原生支持 [PromQL](/user-guide/query-data/promql.md)。在 Dashboard 切到 PromQL tab,运行:
```promql
quantile_over_time(0.95, grpc_latencies{host!=""}[5s])
```
也可以通过 Prometheus 兼容的 HTTP API 查询:
```bash
curl -X POST \
-H 'Authorization: Basic {{authorization if exists}}' \
--data-urlencode 'query=quantile_over_time(0.95, grpc_latencies{host!=""}[5s])' \
--data-urlencode 'start=2024-07-11 20:00:00Z' \
--data-urlencode 'end=2024-07-11 20:00:20Z' \
--data-urlencode 'step=15s' \
'http://localhost:4000/v1/prometheus/api/v1/query_range'
```
返回结果
```json
{
"status": "success",
"data": {
"resultType": "matrix",
"result": [
{
"metric": {
"__name__": "grpc_latencies",
"host": "host1",
"method_name": "GetUser"
},
"values": [
[
1720728015.0,
"3400"
]
]
},
{
"metric": {
"__name__": "grpc_latencies",
"host": "host2",
"method_name": "GetUser"
},
"values": [
[
1720728015.0,
"114"
]
]
}
]
}
}
```
### SQL + PromQL 混合查询
用 [TQL](/reference/sql/tql.md) 在 SQL 里嵌入 PromQL:
```sql
TQL EVAL ('2024-07-11 20:00:00Z', '2024-07-11 20:00:20Z', '15s')
quantile_over_time(0.95, grpc_latencies{host!=""}[5s]);
```
```sql
+---------------------+---------------------------------------------------------+-------+-------------+
| ts | prom_quantile_over_time(ts_range,latency,Float64(0.95)) | host | method_name |
+---------------------+---------------------------------------------------------+-------+-------------+
| 2024-07-11 20:00:15 | 3400 | host1 | GetUser |
| 2024-07-11 20:00:15 | 114 | host2 | GetUser |
+---------------------+---------------------------------------------------------+-------+-------------+
```
还可以把 PromQL 作为 CTE 用在关联查询里:
```sql
WITH
metrics AS (
TQL EVAL ('2024-07-11 20:00:00Z', '2024-07-11 20:00:20Z', '5s')
quantile_over_time(0.95, grpc_latencies{host!=""}[5s])
),
logs AS (
SELECT
ts, host,
COUNT(log_msg) RANGE '5s' AS num_errors
FROM app_logs
WHERE log_level = 'ERROR'
ALIGN '5s'
)
SELECT
m.*,
COALESCE(l.num_errors, 0) AS num_errors
FROM metrics AS m
LEFT JOIN logs AS l ON m.host = l.host AND m.ts = l.ts
ORDER BY m.ts, m.host;
```
```sql
+---------------------+---------------------------------------------------------+-------+-------------+------------+
| ts | prom_quantile_over_time(ts_range,latency,Float64(0.95)) | host | method_name | num_errors |
+---------------------+---------------------------------------------------------+-------+-------------+------------+
| 2024-07-11 20:00:10 | 140.89999999999998 | host1 | GetUser | 10 |
| 2024-07-11 20:00:10 | 113.8 | host2 | GetUser | 0 |
| 2024-07-11 20:00:15 | 3400 | host1 | GetUser | 4 |
| 2024-07-11 20:00:15 | 114 | host2 | GetUser | 0 |
| 2024-07-11 20:00:20 | 3375 | host1 | GetUser | 0 |
| 2024-07-11 20:00:20 | 115 | host2 | GetUser | 0 |
+---------------------+---------------------------------------------------------+-------+-------------+------------+
```
## GreptimeDB Dashboard
GreptimeDB 内置了 [Dashboard](./installation/greptimedb-dashboard.md),用于数据探索和管理。
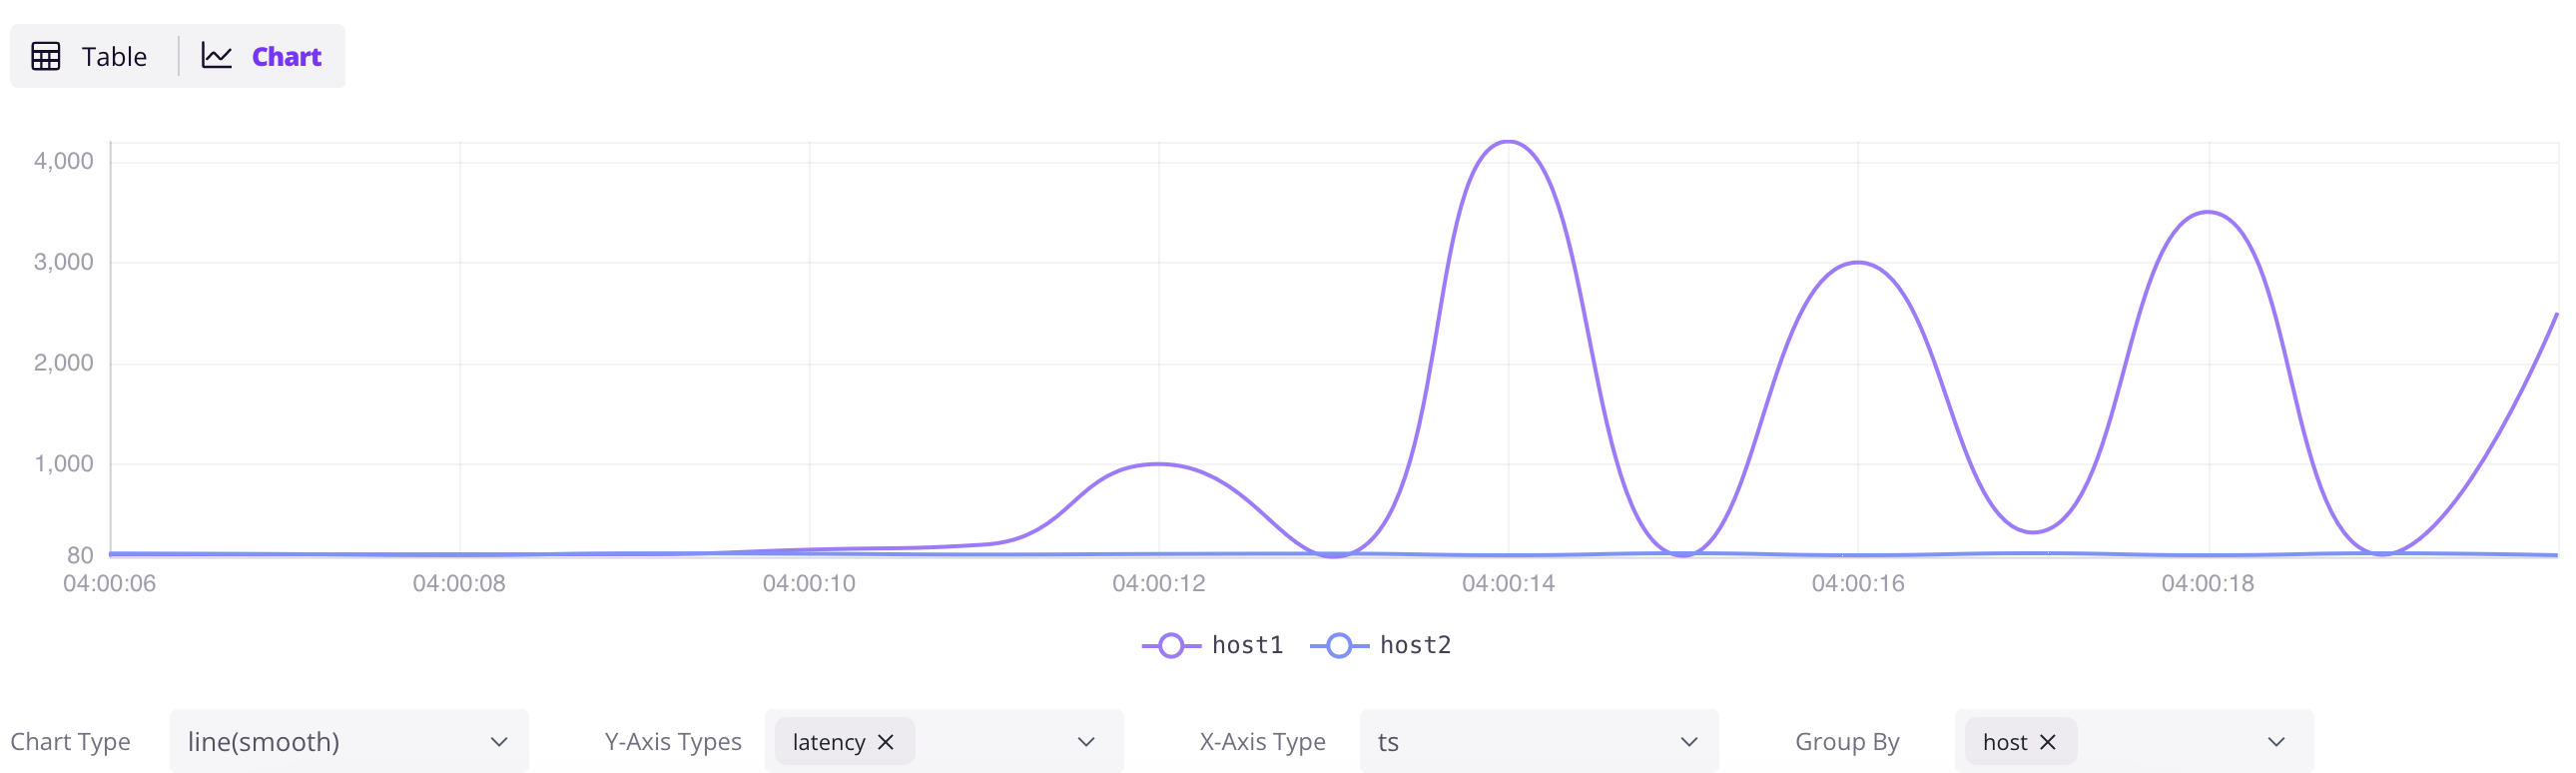
### 数据探索
打开 `http://localhost:4000/dashboard`,点 `+` 新建查询,输入 SQL,点 `Run All` 执行。点结果面板的 `Chart` 按钮可以可视化数据。
```sql
SELECT * FROM grpc_latencies;
```
### 用 InfluxDB Line Protocol 写入
点 Dashboard 的 `Ingest` 图标,可以用 [InfluxDB Line Protocol](/user-guide/ingest-data/for-iot/influxdb-line-protocol.md) 格式写入数据:
```txt
grpc_metrics,host=host1,method_name=GetUser latency=100,code=0 1720728021000000000
grpc_metrics,host=host2,method_name=GetUser latency=110,code=1 1720728021000000000
```
点 `Write` 写入。`grpc_metrics` 表不存在会自动创建——这就是 GreptimeDB 的 [Schemaless](/user-guide/ingest-data/overview.md#自动生成表结构) 能力。
## 下一步
**接入现有栈:**
- [Prometheus Remote Write](/user-guide/ingest-data/for-observability/prometheus.md) — 把 Prometheus 指向 GreptimeDB
- [OpenTelemetry](/user-guide/ingest-data/for-observability/opentelemetry.md) — 配置 OTel Collector 发送 metrics、logs、traces
- [Jaeger](/user-guide/query-data/jaeger.md) — 用 GreptimeDB 作为 Jaeger 的存储后端
- [Loki](/user-guide/ingest-data/for-observability/loki.md) — 用 Loki 协议发送日志
- [Elasticsearch](/user-guide/ingest-data/for-observability/elasticsearch/) — 用 Elasticsearch `_bulk` API 发送日志、traces 和事件
- 查看[所有写入方式](/user-guide/ingest-data/overview/#推荐的数据写入方法)
**可视化和监控:**
- [Grafana 集成](/user-guide/integrations/grafana.md) — 用 SQL 或 PromQL 数据源连接 Grafana
- [内置 Dashboard](/getting-started/installation/greptimedb-dashboard.md) — `http://localhost:4000/dashboard`
**深入了解:**
- [为什么选择 GreptimeDB](/user-guide/concepts/why-greptimedb.md) — 架构、成本对比、竞品比较
- [Observability 2.0](/user-guide/concepts/observability-2.md) — 宽事件和统一数据模型
- [Demo 场景](https://github.com/GreptimeTeam/demo-scene/) — 更多动手示例
- [用户指南](/user-guide/overview.md) — 完整参考