Jaeger (Experimental)
The Jaeger query APIs are currently in the experimental stage and may be adjusted in future versions.
GreptimeDB currently supports the following Jaeger query interfaces:
/api/services: Get all services./api/operations?service={service}: Get all operations for a service./api/services/{service}/operations: Get all operations for a service./api/traces: Get traces by query parameters.
You can use Grafana's Jaeger plugin or Jaeger UI to query traces data in GreptimeDB. When using Jaeger UI, you can set the proxyConfig in packages/jaeger-ui/vite.config.mts to the GreptimeDB address, for example:
const proxyConfig = {
  target: 'http://localhost:4000/v1/jaeger',
  secure: false,
  changeOrigin: true,
  ws: true,
  xfwd: true,
};
Currently, GreptimeDB exposes the Jaeger HTTP APIs under the /v1/jaeger endpoint.
Quick Start
We will use the Jaeger plugin in Grafana as an example to demonstrate how to query traces data in GreptimeDB. Before starting, please ensure that you have properly started GreptimeDB.
Start an application to generate traces data and write it to GreptimeDB
You can refer to the OpenTelemetry official documentation to choose any programming language you are familiar with to generate traces data. You can also refer to the Configure OpenTelemetry Collector document.
Configure the Grafana Jaeger plugin
-
Open Grafana and add a Jaeger data source:
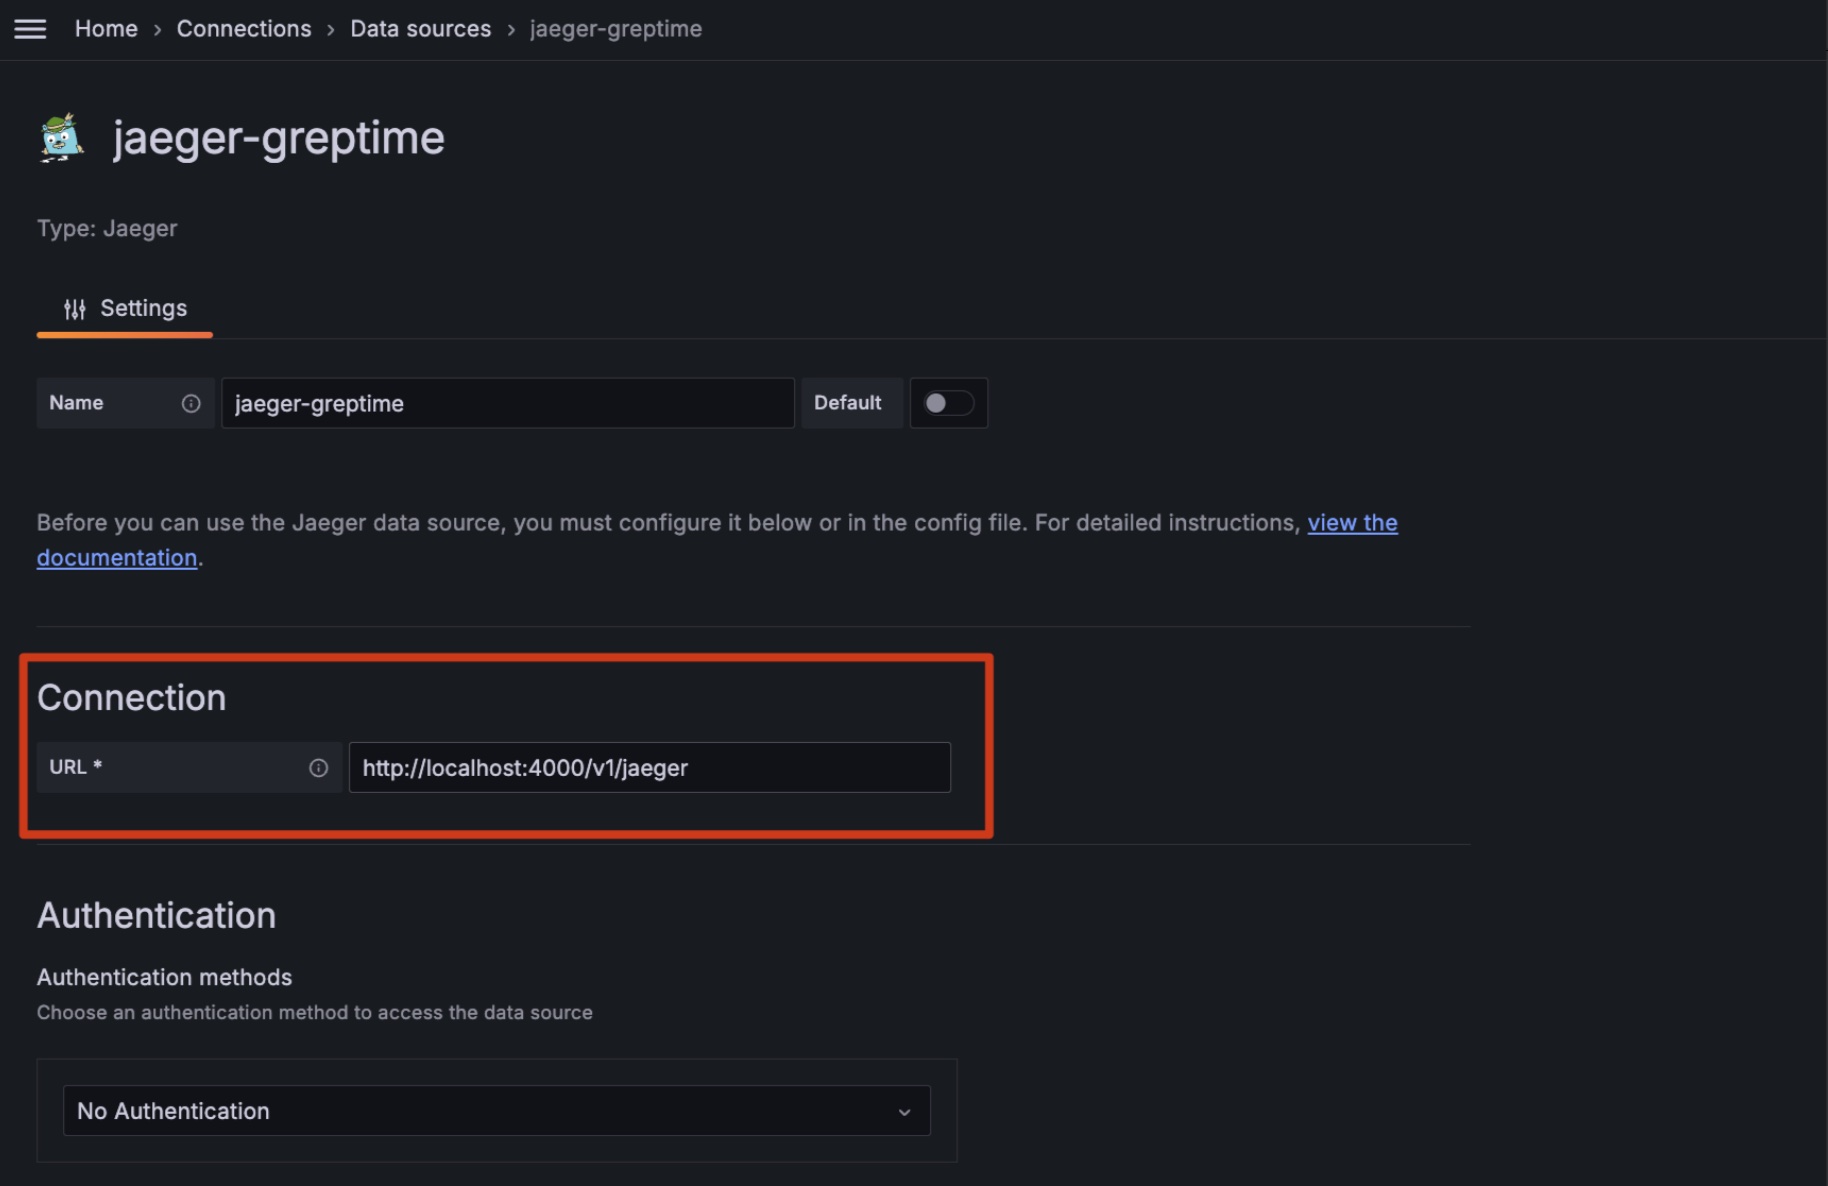
-
Fill in the Jaeger address according to your actual situation, then Save and Test. For example:
http://localhost:4000/v1/jaeger -
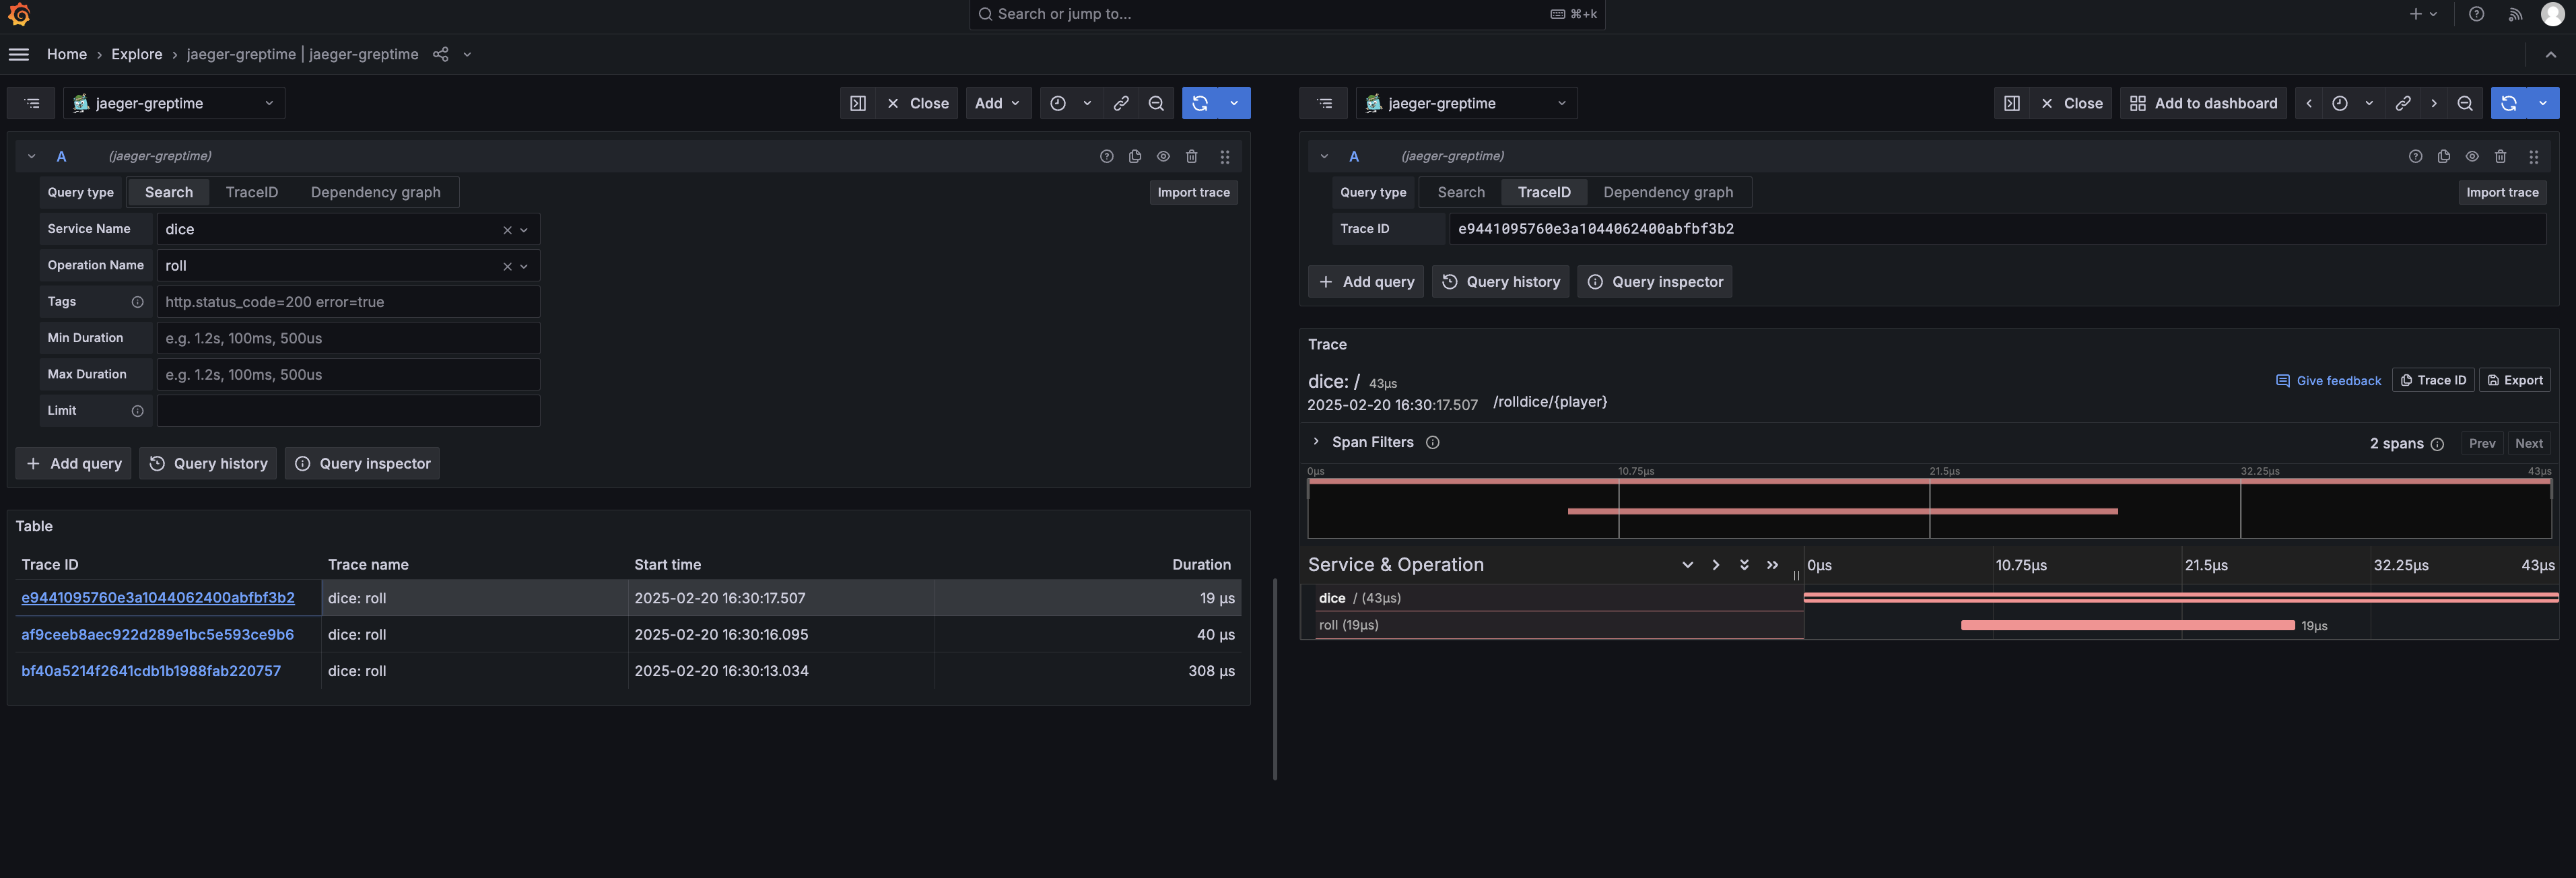
Use Grafana's Jaeger Explore to view the data:
Add Time Range for Getting Operations Endpoints
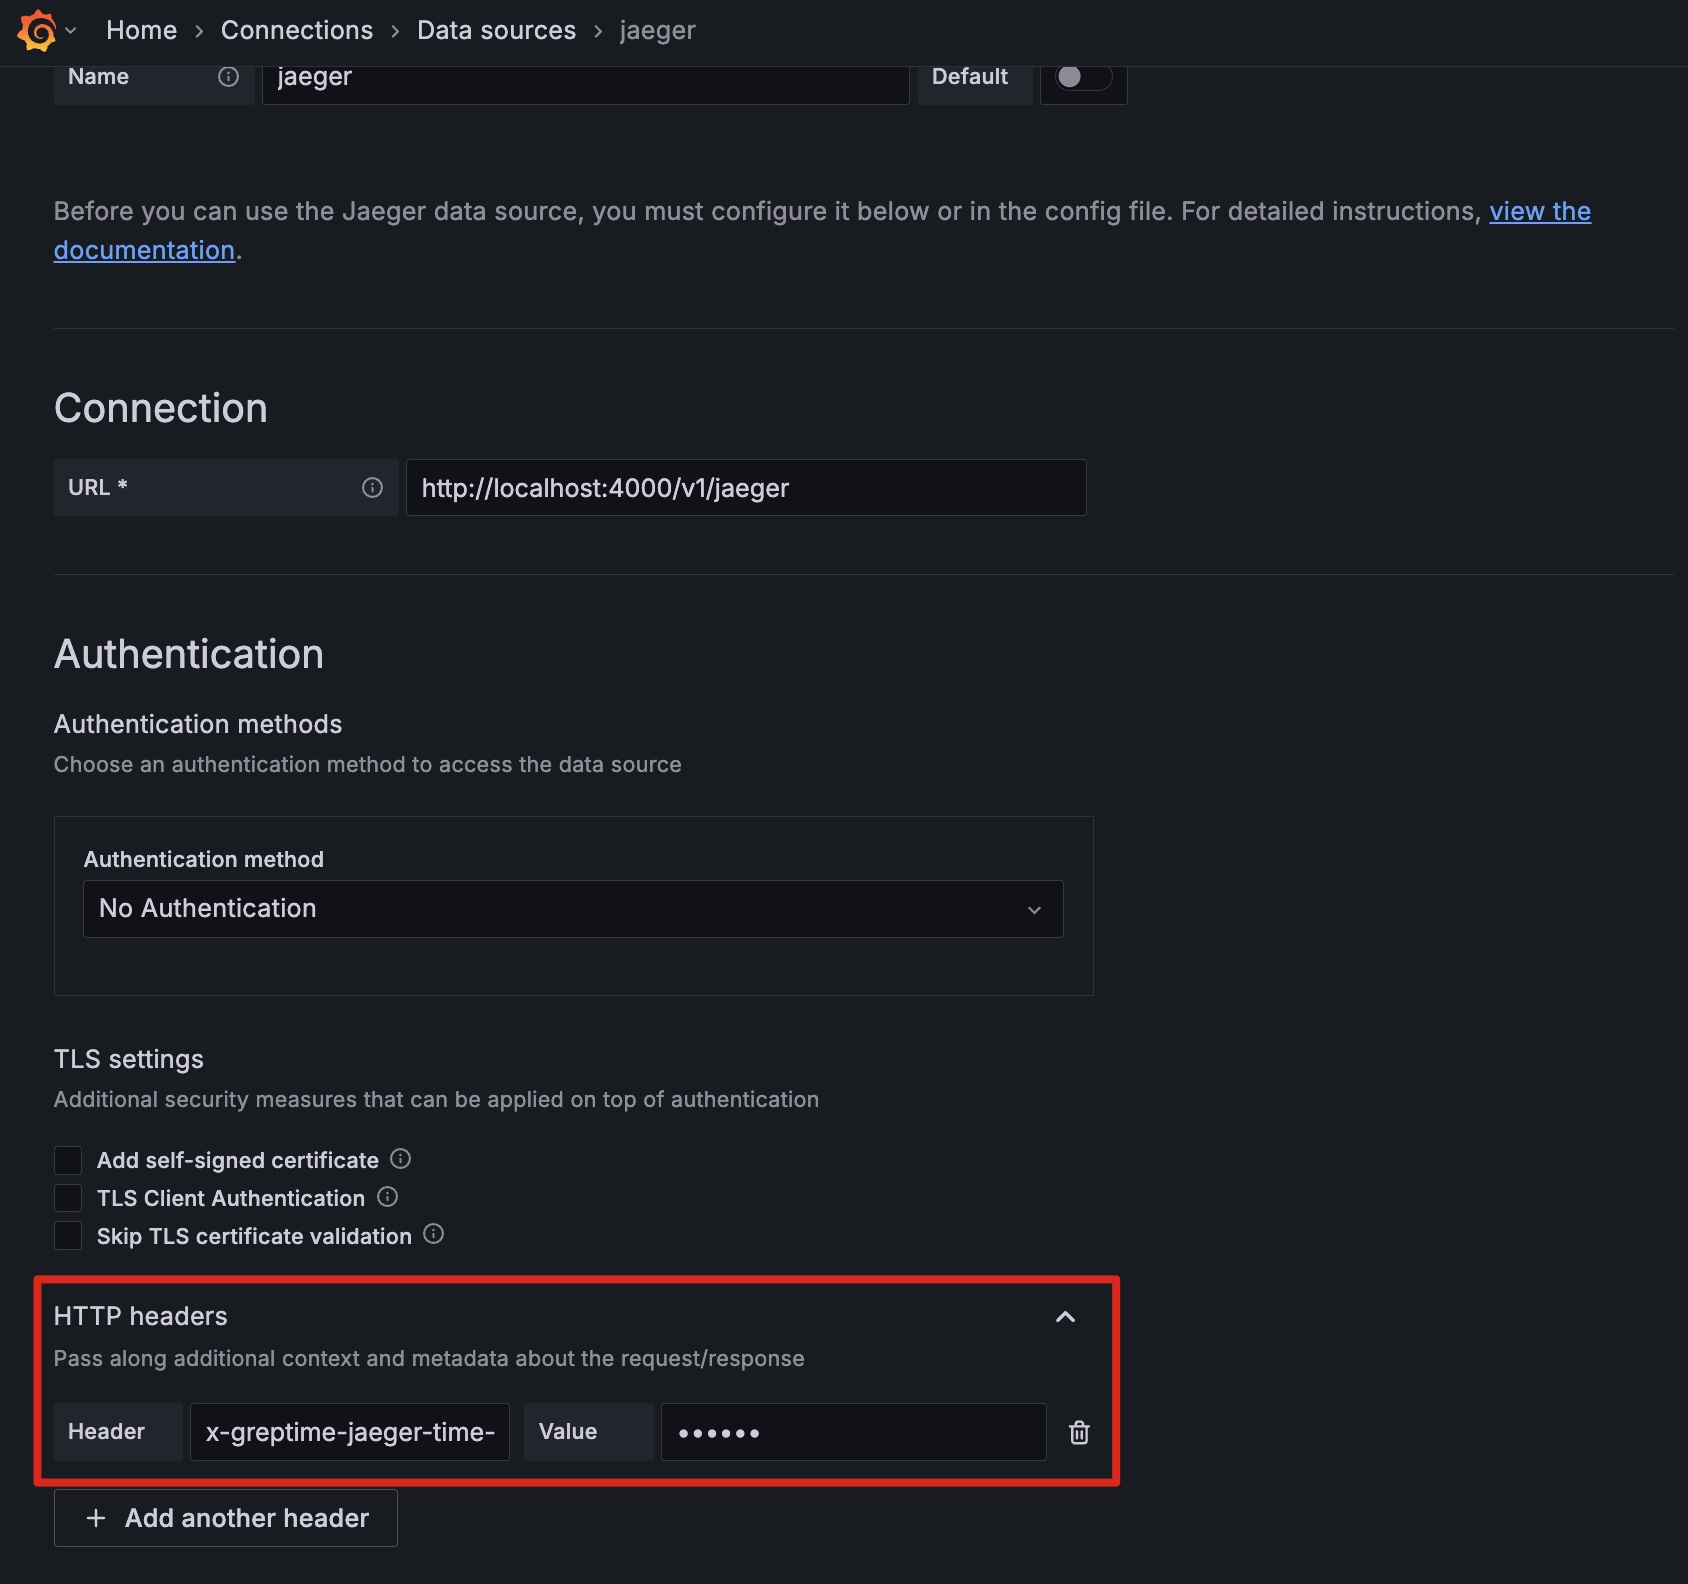
By default, we don't add time range parameters for the GET /api/operations and GET /api/services/{service}/operations endpoints. When the volume of traces data is large, this may lead to long query times. You can add a time range parameter by setting the HTTP Header based on your specific scenario, for example:
x-greptime-jaeger-time-range-for-operations: 3 days
This indicates that only the Operations data from the past 3 days will be returned.
This header can be set in the HTTP Headers of the Jaeger Data Source, for example: