Prometheus
GreptimeDB can serve as a long-term storage solution for Prometheus, providing a seamless integration experience.
Remote write configuration
Prometheus configuration file
To configure Prometheus with GreptimeDB,
update your Prometheus configuration file (prometheus.yml) as follows:
remote_write:
- url: http://localhost:4000/v1/prometheus/write?db=public
# Uncomment and set credentials if authentication is enabled
#  basic_auth:
#    username: greptime_user
#    password: greptime_pwd

remote_read:
- url: http://localhost:4000/v1/prometheus/read?db=public
# Uncomment and set credentials if authentication is enabled
#  basic_auth:
#    username: greptime_user
#    password: greptime_pwd
- The host and port in the URL represent the GreptimeDB server. In this example, the server is running on
localhost:4000. You can replace it with your own server address. For the HTTP protocol configuration in GreptimeDB, please refer to the protocol options. - The
dbparameter in the URL represents the database to which we want to write data. It is optional. By default, the database is set topublic. basic_authis the authentication configuration. Fill in the username and password if GreptimeDB authentication is enabled. Please refer to the authentication document.
Grafana Alloy configuration file
If you are using Grafana Alloy, configure the remote write endpoint in the Alloy configuration file (config.alloy). For more information, refer to the Alloy documentation.
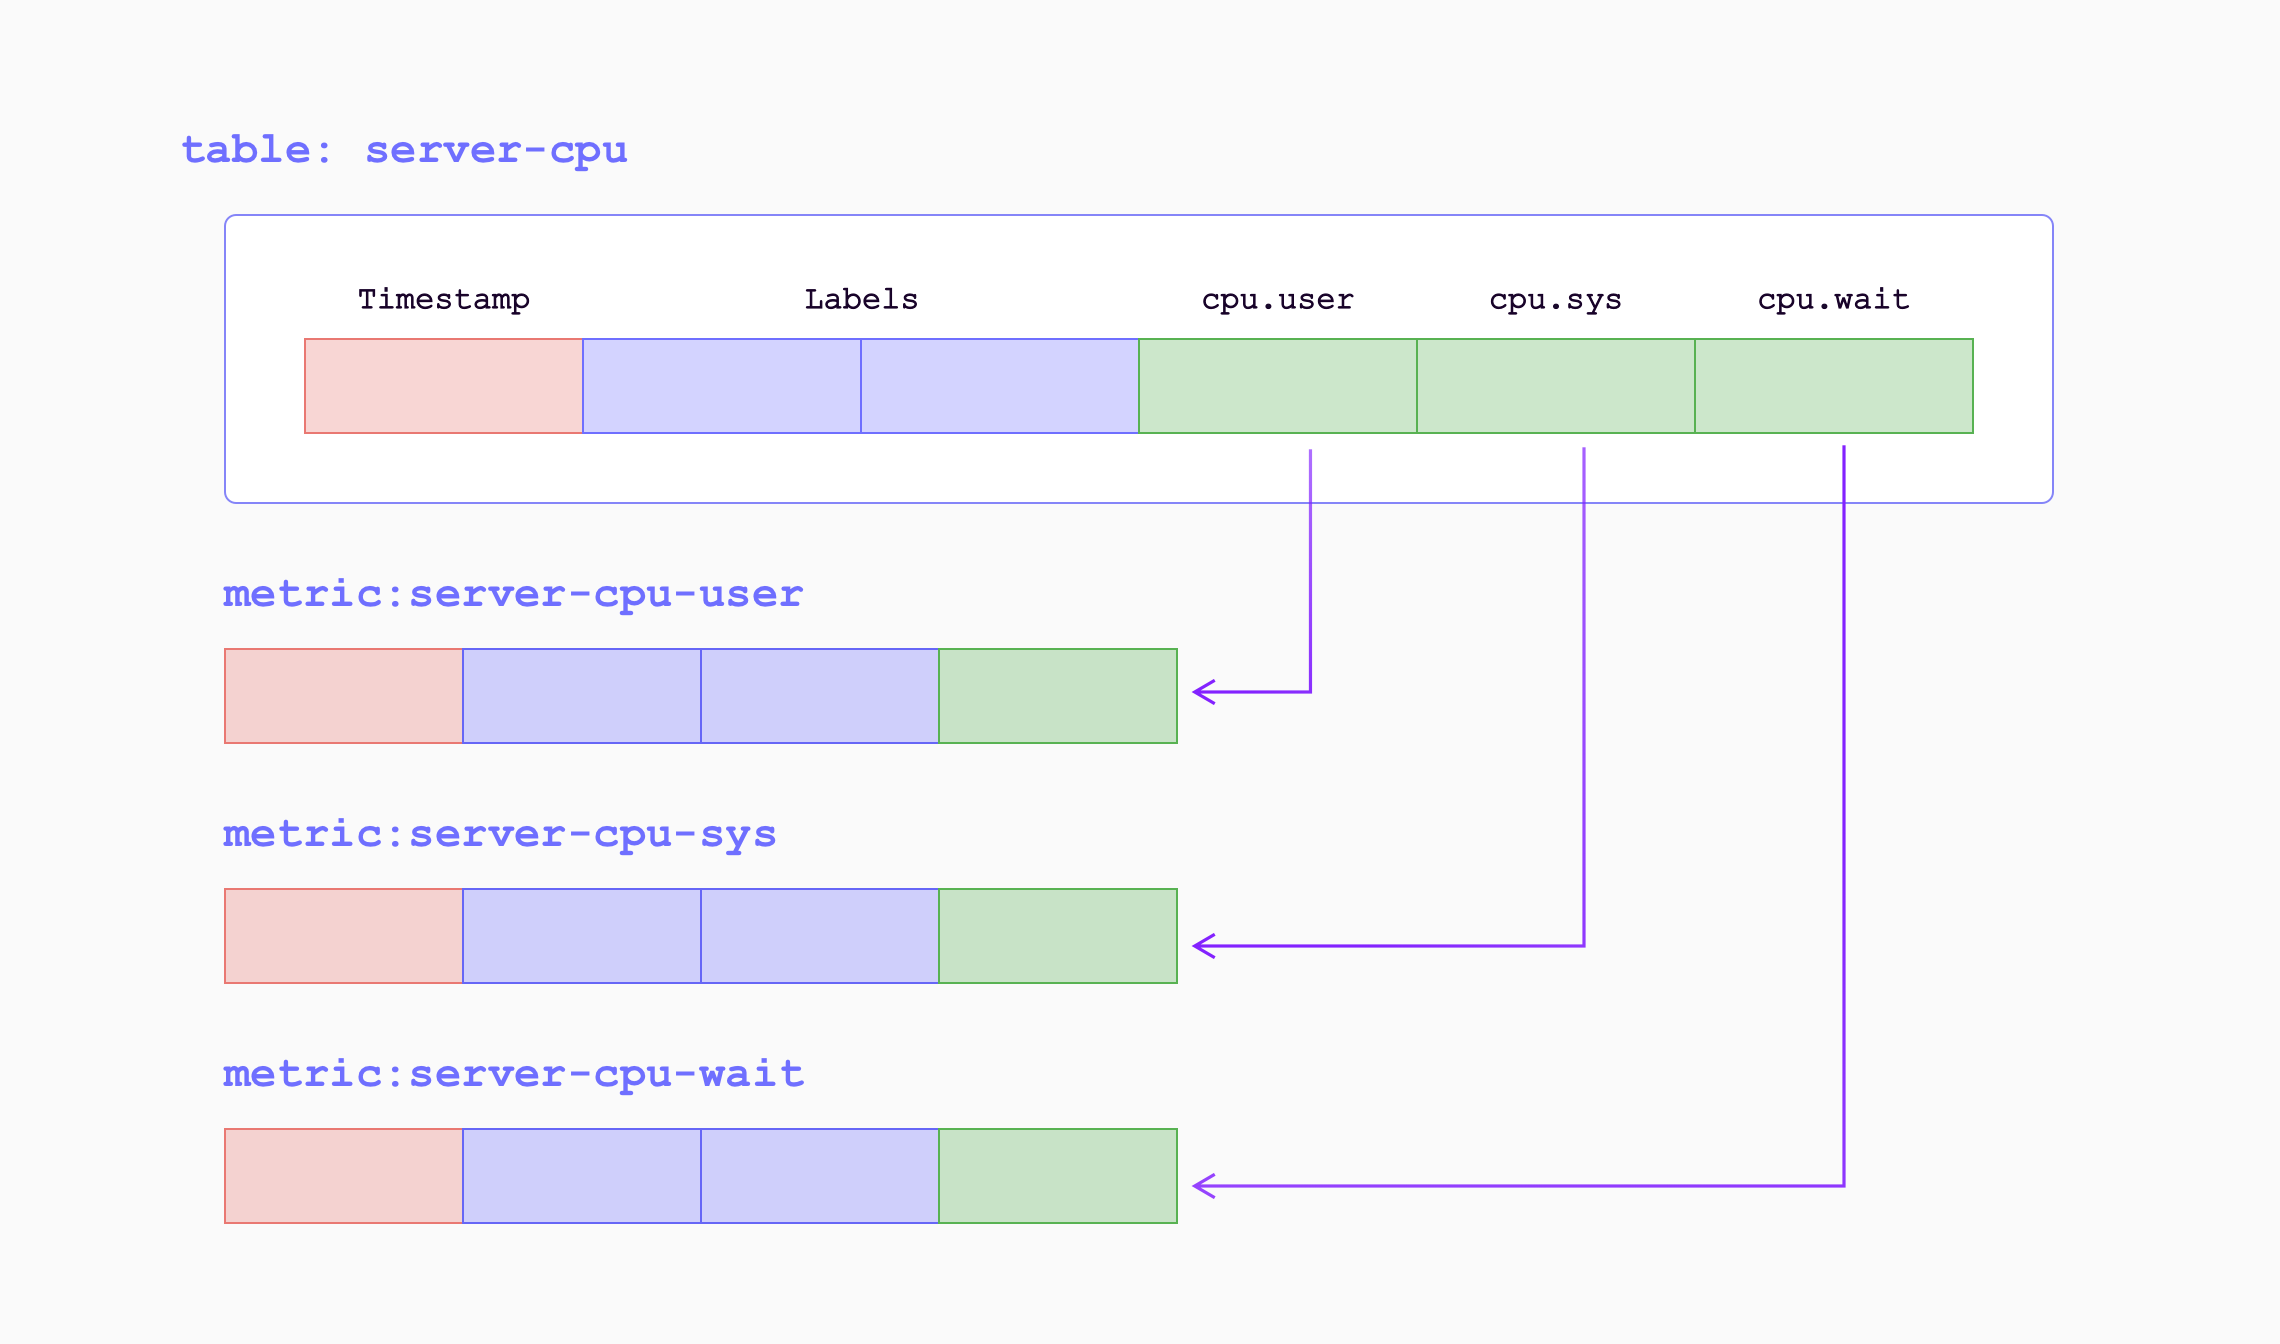
Data Model
In the data model of GreptimeDB, data is organized into tables with columns for tags, time index, and fields. GreptimeDB can be thought of as a multi-value data model, automatically grouping multiple Prometheus metrics into corresponding tables. This allows for efficient data management and querying.
When the metrics are written into GreptimeDB by remote write endpoint, they will be transformed as follows:
| Sample Metrics | In GreptimeDB | GreptimeDB Data Types |
|---|---|---|
| Name | Table (Auto-created) Name | String |
| Value | Column (Field) | Double |
| Timestamp | Column (Time Index) | Timestamp |
| Label | Column (Tag) | String |
For example, the following Prometheus metric:
prometheus_remote_storage_samples_total{instance="localhost:9090", job="prometheus",
remote_name="648f0c", url="http://localhost:4000/v1/prometheus/write"} 500
will be transformed as a row in the table prometheus_remote_storage_samples_total:
| Column | Value | Column Data Type |
|---|---|---|
| instance | localhost:9090 | String |
| job | prometheus | String |
| remote_name | 648f0c | String |
| url | http://localhost:4000/v1/prometheus/write | String |
| greptime_value | 500 | Double |
| greptime_timestamp | The sample's unix timestamp | Timestamp |
Improve efficiency by using metric engine
The Prometheus remote writing always creates a large number of small tables. These tables are classified as logical tables in GreptimeDB. However, having a large number of small tables can be inefficient for both data storage and query performance. To address this, GreptimeDB introduces the metric engine feature, which stores the data represented by the logical tables in a single physical table. This approach reduces storage overhead and improves columnar compression efficiency.
The metric engine is enabled by default in GreptimeDB,
and you don't need to specify any additional configuration.
By default, the physical table used is greptime_physical_table.
If you want to use a specific physical table, you can specify the physical_table parameter in the remote write URL.
If the specified physical table doesn't exist, it will be automatically created.
remote_write:
- url: http://localhost:4000/v1/prometheus/write?db=public&physical_table=greptime_physical_table
Data is stored in the physical table, while queries are performed on logical tables to provide an intuitive view from a metric perspective. For instance, when successfully writing data, you can use the following command to display the logical tables:
show tables;
+---------------------------------------------------------------+
| Tables                                                        |
+---------------------------------------------------------------+
| prometheus_remote_storage_enqueue_retries_total               |
| prometheus_remote_storage_exemplars_pending                   |
| prometheus_remote_storage_read_request_duration_seconds_count |
| prometheus_rule_group_duration_seconds                        |
| ......                                                        |
+---------------------------------------------------------------+
The physical table itself can also be queried. It contains columns from all the logical tables, making it convenient for multi-join analysis and computation.
To view the schema of the physical table, use the DESC TABLE command:
DESC TABLE greptime_physical_table;
The physical table includes all the columns from the logical tables:
+--------------------+----------------------+------+------+---------+---------------+
| Column             | Type                 | Key  | Null | Default | Semantic Type |
+--------------------+----------------------+------+------+---------+---------------+
| greptime_timestamp | TimestampMillisecond | PRI  | NO   |         | TIMESTAMP     |
| greptime_value     | Float64              |      | YES  |         | FIELD         |
| __table_id         | UInt32               | PRI  | NO   |         | TAG           |
| __tsid             | UInt64               | PRI  | NO   |         | TAG           |
| device             | String               | PRI  | YES  |         | TAG           |
| instance           | String               | PRI  | YES  |         | TAG           |
| job                | String               | PRI  | YES  |         | TAG           |
| error              | String               | PRI  | YES  |         | TAG           |
...
You can use the SELECT statement to filter data from the physical table as needed.
For example, you can filter data based on the device condition from logical table A and the job condition from logical table B:
SELECT *
FROM greptime_physical_table
WHERE greptime_timestamp > "2024-08-07 03:27:26.964000"
  AND device = "device1"
  AND job = "job1";
VictoriaMetrics remote write
VictoriaMetrics slightly modified Prometheus remote write protocol for better
compression. The protocol is automatically enabled when you are using vmagent
to send data to a compatible backend.
GreptimeDB has this variant supported, too. Just configure GreptimeDB's remote
write url for vmagent. For example, if you have GreptimeDB installed locally:
vmagent -remoteWrite.url=http://localhost:4000/v1/prometheus/write