Prometheus
GreptimeDB 可以作为 Prometheus 的长期存储解决方案,提供无缝集成体验。
配置 Remote Write
Prometheus 配置文件
要将 GreptimeDB 集成到 Prometheus 中,
请按照以下步骤更新你的 Prometheus 配置文件(prometheus.yml):
remote_write:
- url: http://localhost:4000/v1/prometheus/write?db=public
# 如果启用了身份验证,请取消注释并设置鉴权信息
#  basic_auth:
#    username: greptime_user
#    password: greptime_pwd

remote_read:
- url: http://localhost:4000/v1/prometheus/read?db=public
# 如果启用了身份验证,请取消注释并设置鉴权信息
#  basic_auth:
#    username: greptime_user
#    password: greptime_pwd
- URL 中的 host 和 port 表示 GreptimeDB 服务器。在此示例中,服务器运行在
localhost:4000上。你可以将其替换为你自己的服务器地址。有关 GreptimeDB 中 HTTP 协议的配置,请参阅 协议选项。 - URL 中的
db参数表示要写入的数据库。它是可选的。默认情况下,数据库设置为public。 basic_auth是身份鉴权配置。如果 GreptimeDB 启用了鉴权,请填写用户名和密码。请参阅 鉴权认证文档。
Grafana Alloy 配置文件
如果你使用 Grafana Alloy,请在 Alloy 配置文件(config.alloy)中配置 Remote Write。有关更多信息,请参阅 Alloy 文档。
数据模型
在 GreptimeDB 的数据模型中,数据被组织成具有 tag、time index 和 field 的表。 GreptimeDB 可以被视为多值数据模型,自动将多个 Prometheus 指标分组到相应的表中。 这样可以实现高效的数据管理和查询。
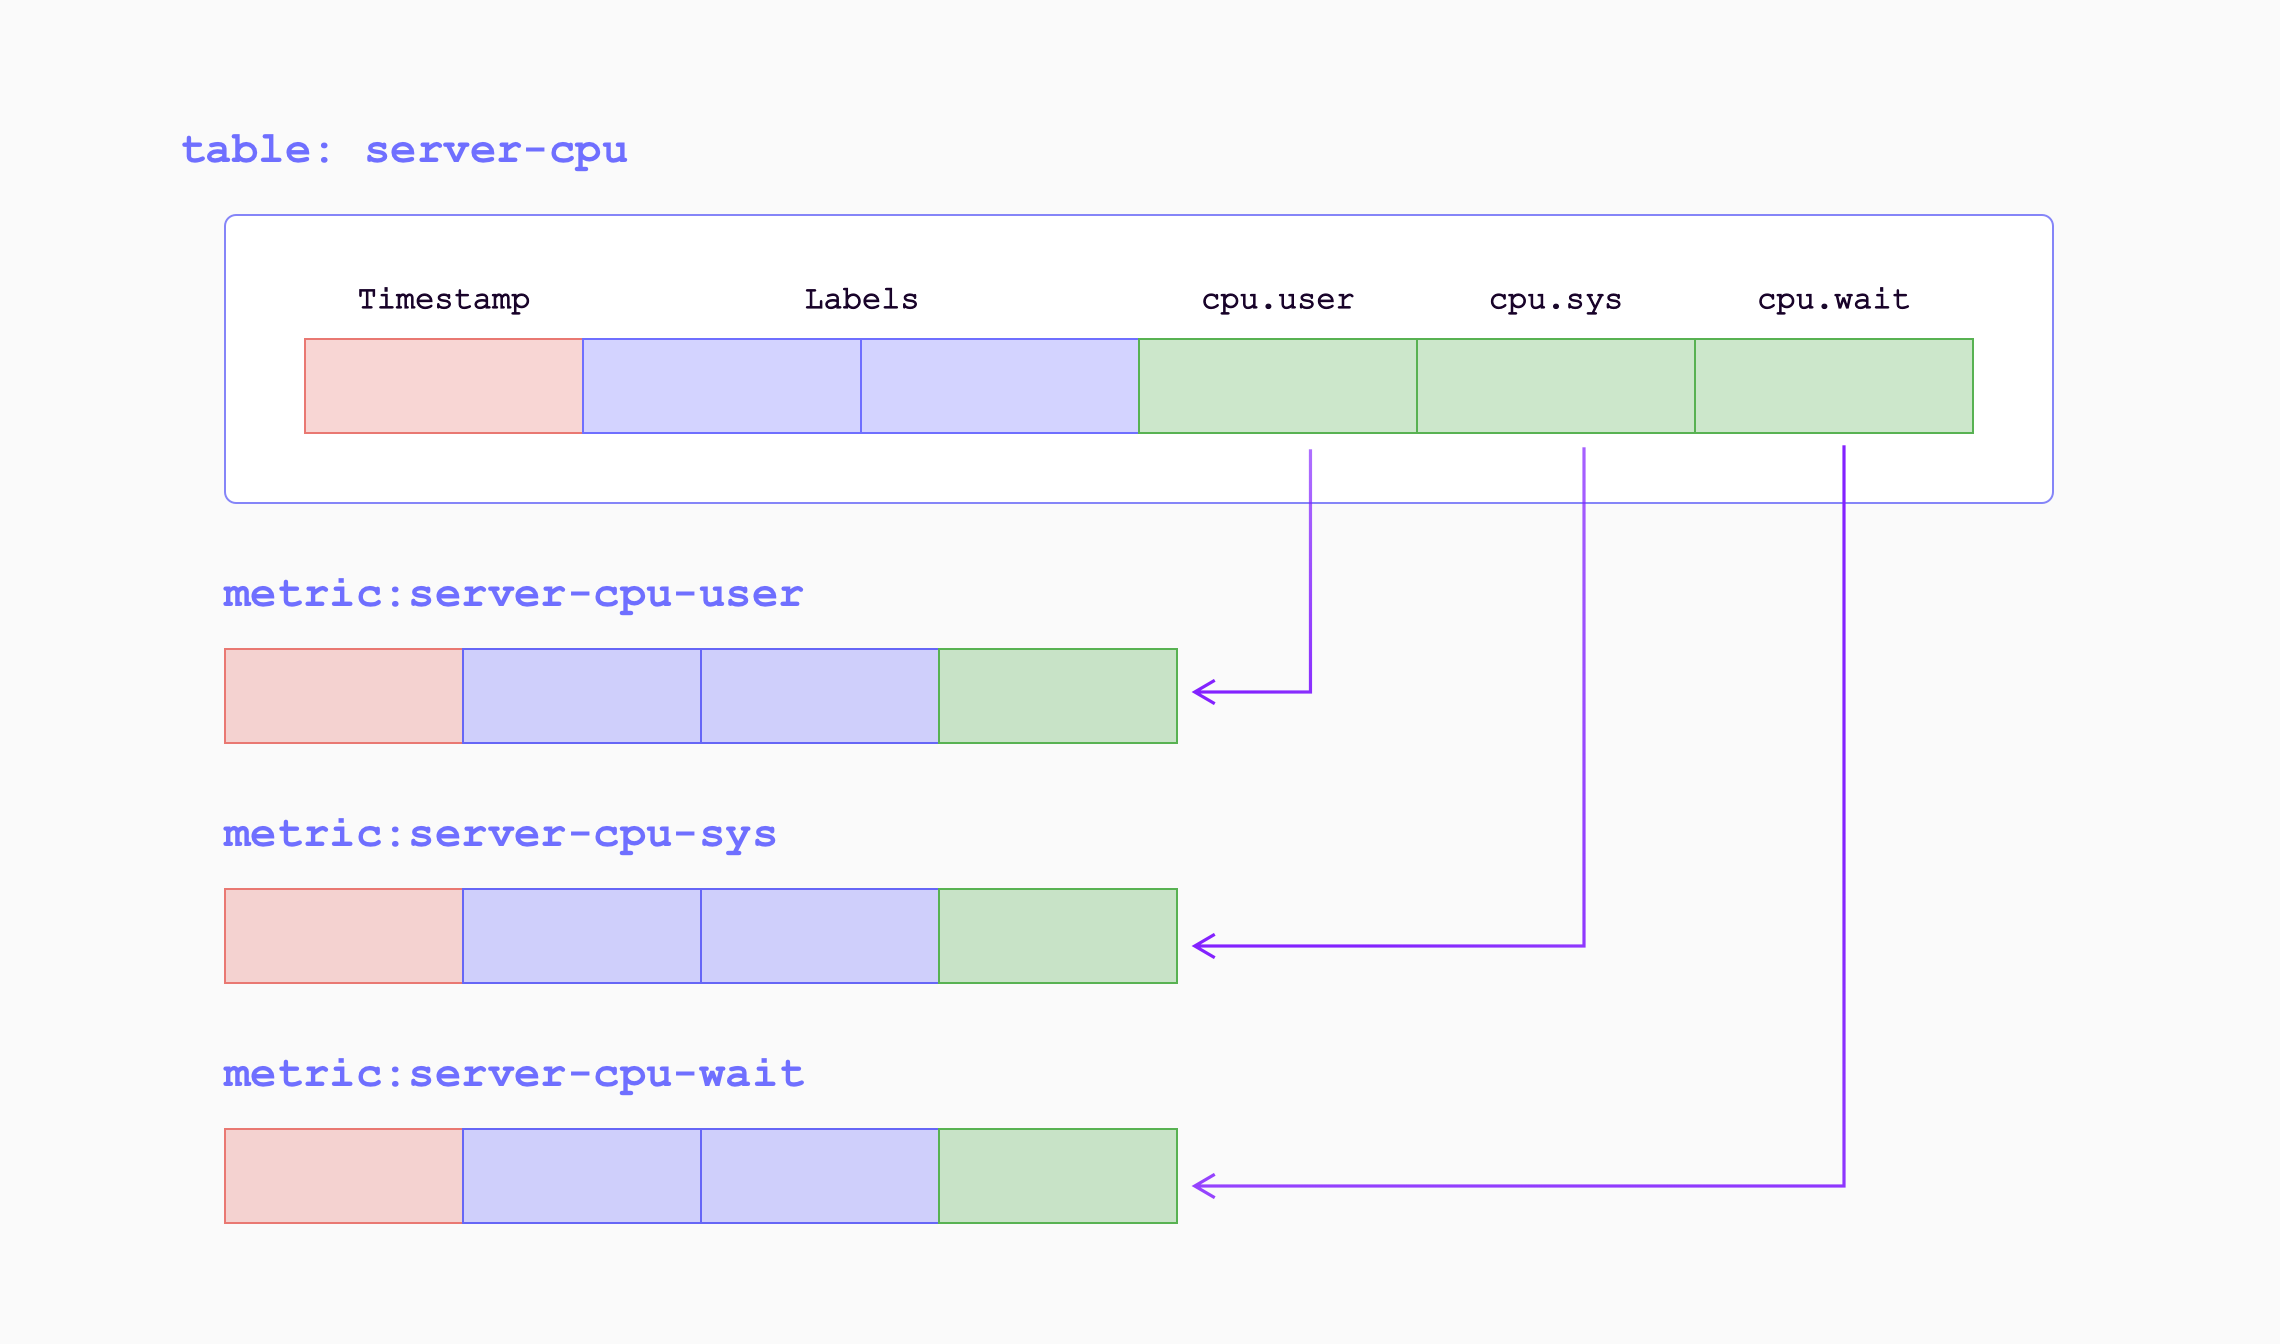
当指标通过远程写入端点写入 GreptimeDB 时,它们将被转换为以下形式:
| Sample Metrics | In GreptimeDB | GreptimeDB Data Types |
|---|---|---|
| Name | Table (Auto-created) Name | String |
| Value | Column (Field) | Double |
| Timestamp | Column (Time Index) | Timestamp |
| Label | Column (Tag) | String |
例如,以下 Prometheus 指标:
prometheus_remote_storage_samples_total{instance="localhost:9090", job="prometheus",
remote_name="648f0c", url="http://localhost:4000/v1/prometheus/write"} 500
将被转换为表 prometheus_remote_storage_samples_total 中的一行:
| Column | Value | Column Data Type |
|---|---|---|
| instance | localhost:9090 | String |
| job | prometheus | String |
| remote_name | 648f0c | String |
| url | http://localhost:4000/v1/prometheus/write | String |
| greptime_value | 500 | Double |
| greptime_timestamp | The sample's unix timestamp | Timestamp |
通过使用 metric engine 提高效率
Prometheus Remote Write 写入数据的方式经常会创建大量的小表,这些表在 GreptimeDB 中被归类为逻辑表。 然而,拥有大量的小表对于数据存储和查询性能来说是低效的。 为了解决这个问题,GreptimeDB 引入了 metric engine 功能,将逻辑表表示的数据存储在单个物理表中。 这种方法减少了存储开销并提高了列式压缩效率。
GreptimeDB 默认启用 metric engine,你不需要指定任何额外的配置。
默认情况下,使用的物理表为 greptime_physical_table。
如果你想使用特定的物理表,可以在 Remote Write URL 中指定 physical_table 参数。
如果指定的物理表不存在,它将被自动创建。
remote_write:
- url: http://localhost:4000/v1/prometheus/write?db=public&physical_table=greptime_physical_table
虽然数据被存储在物理表中,但查询可以在逻辑表上执行以提供从指标角度的直观视角。 例如,当成功写入数据时,你可以使用以下命令显示逻辑表:
show tables;
+---------------------------------------------------------------+
| Tables                                                        |
+---------------------------------------------------------------+
| prometheus_remote_storage_enqueue_retries_total               |
| prometheus_remote_storage_exemplars_pending                   |
| prometheus_remote_storage_read_request_duration_seconds_count |
| prometheus_rule_group_duration_seconds                        |
| ......                                                        |
+---------------------------------------------------------------+
物理表本身也可以进行查询。 它包含了所有逻辑表的列,方便进行多表连接分析和计算。
要查看物理表的 schema,请使用 DESC TABLE 命令:
DESC TABLE greptime_physical_table;
物理表包含了所有逻辑表的列:
+--------------------+----------------------+------+------+---------+---------------+
| Column             | Type                 | Key  | Null | Default | Semantic Type |
+--------------------+----------------------+------+------+---------+---------------+
| greptime_timestamp | TimestampMillisecond | PRI  | NO   |         | TIMESTAMP     |
| greptime_value     | Float64              |      | YES  |         | FIELD         |
| __table_id         | UInt32               | PRI  | NO   |         | TAG           |
| __tsid             | UInt64               | PRI  | NO   |         | TAG           |
| device             | String               | PRI  | YES  |         | TAG           |
| instance           | String               | PRI  | YES  |         | TAG           |
| job                | String               | PRI  | YES  |         | TAG           |
| error              | String               | PRI  | YES  |         | TAG           |
...
你可以使用 SELECT 语句根据需要从物理表中过滤数据。
例如,根据逻辑表 A 的 device 条件和逻辑表 B 的 job 条件来过滤数据:
SELECT *
FROM greptime_physical_table
WHERE greptime_timestamp > "2024-08-07 03:27:26.964000"
  AND device = "device1"
  AND job = "job1";
VictoriaMetrics Remote Write
VictoriaMetrics 对 Prometheus 远程写入协议进行了轻微修改,以实现更好的压缩效果。
当你使用 vmagent 将数据发送到兼容的后端时,该协议会被自动启用。
GreptimeDB 也支持这个变种。只需将 GreptimeDB 的 Remote Write URL 配置为 vmagent。
例如,如果你在本地安装了 GreptimeDB:
vmagent -remoteWrite.url=http://localhost:4000/v1/prometheus/write