Grafana
GreptimeDB 服务可以配置为 Grafana 数据源。 你可以选择使用以下三个数据源之一连接 GreptimeDB 与 Grafana:GreptimeDB、Prometheus 或 MySQL。
GreptimeDB 数据源插件
GreptimeDB 数据源插件(v2.x)基于 ClickHouse 插件开发并附加了特定于 GreptimeDB 的功能。 该插件完美适配了 GreptimeDB 的数据模型, 从而提供了更好的用户体验。
安装
GreptimeDB 数据源插件目前仅支持在本地 Grafana 中的安装, 在安装插件前请确保 Grafana 已经安装并运行。
你可以任选以下一种安装方式:
- 下载安装包并解压到相关目录:从发布页面获取最新版本,解压文件到你的 grafana 插件目录。
- 使用 Grafana Cli 下载并安装:
grafana cli --pluginUrl https://github.com/GreptimeTeam/greptimedb-grafana-datasource/releases/latest/download/info8fcc-greptimedb-datasource.zip plugins install info8fcc - 使用我们 预构建的 Grafana 镜
像,已经提前包含了
GreptimeDB 数据源插件
docker run -p 3000:3000 greptime/grafana-greptimedb:latest
注意,安装插件后可能需要重新启动 Grafana 服务器。
Connection 配置
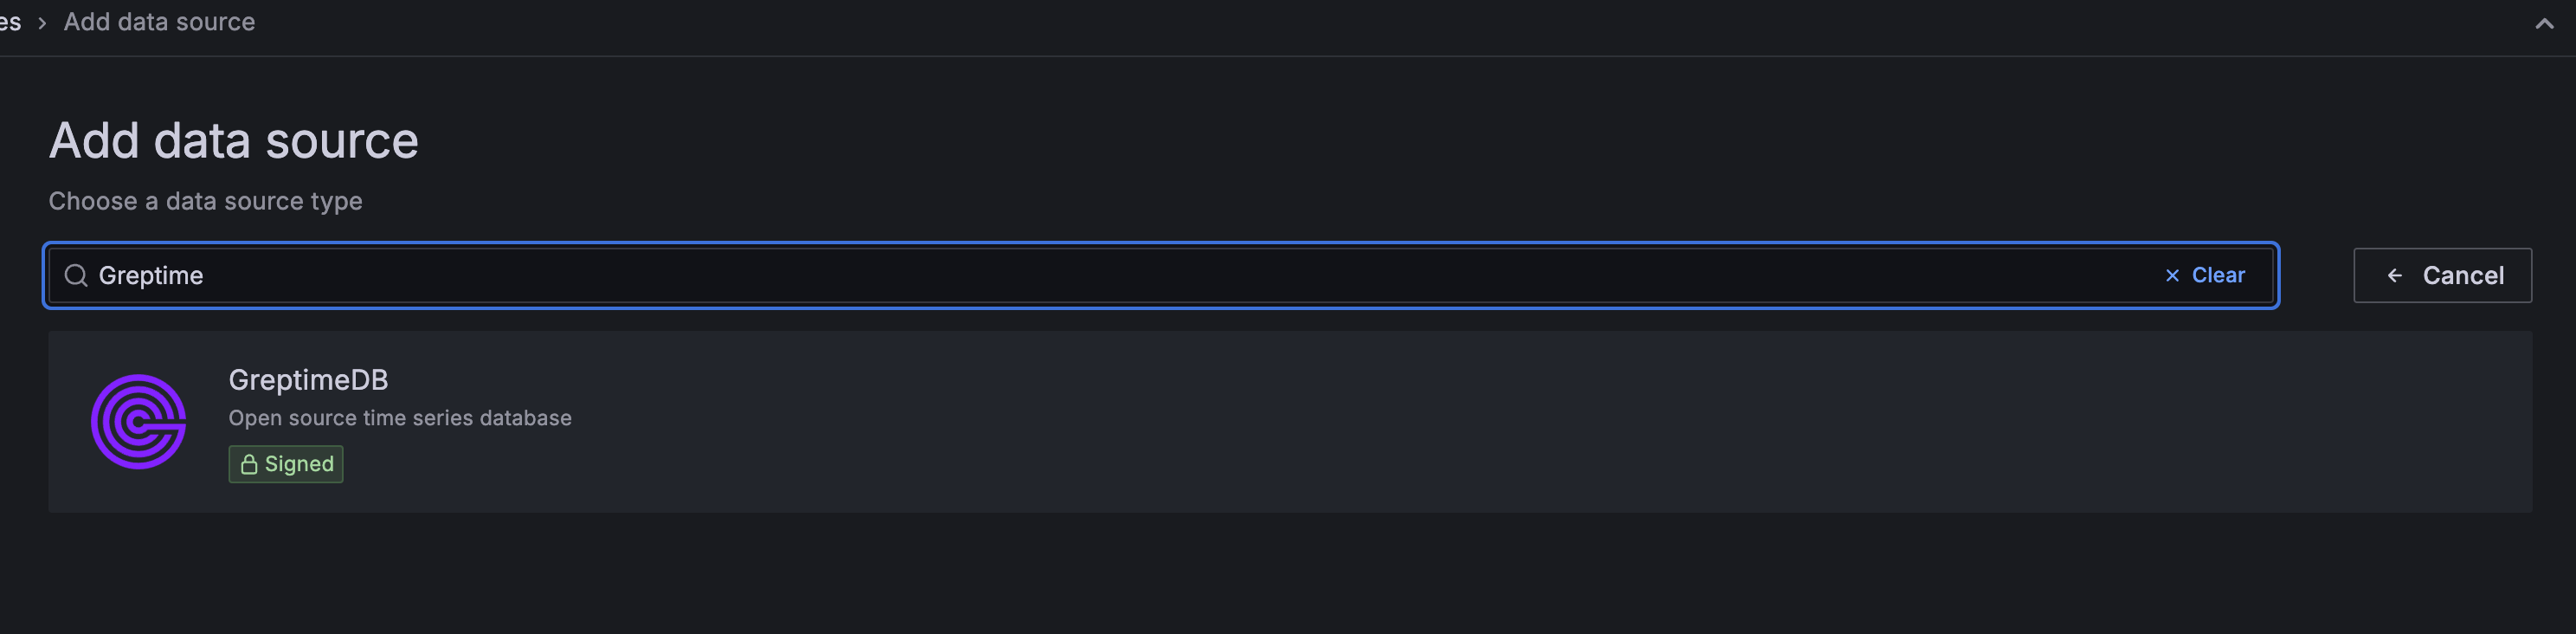
在 Grafana 中单击 Add data source 按钮,选择 GreptimeDB 作为类型。
在 GreptimeDB server URL 中填写以下地址:
http://<host>:4000
在 Auth 部分中单击 basic auth,并在 Basic Auth Details 中填写 GreptimeDB 的用户名和密码。未设置可留空:
- User:
<username> - Password:
<password>
然后单击 Save & Test 按钮以测试连接。
基础查询设置
在进行所有类型查询选择前,需要先设置要查询的数据库和表
| 设置项 | 对应值 |
|---|---|
| Database | 选择数据库 |
| Table | 选择表格 |

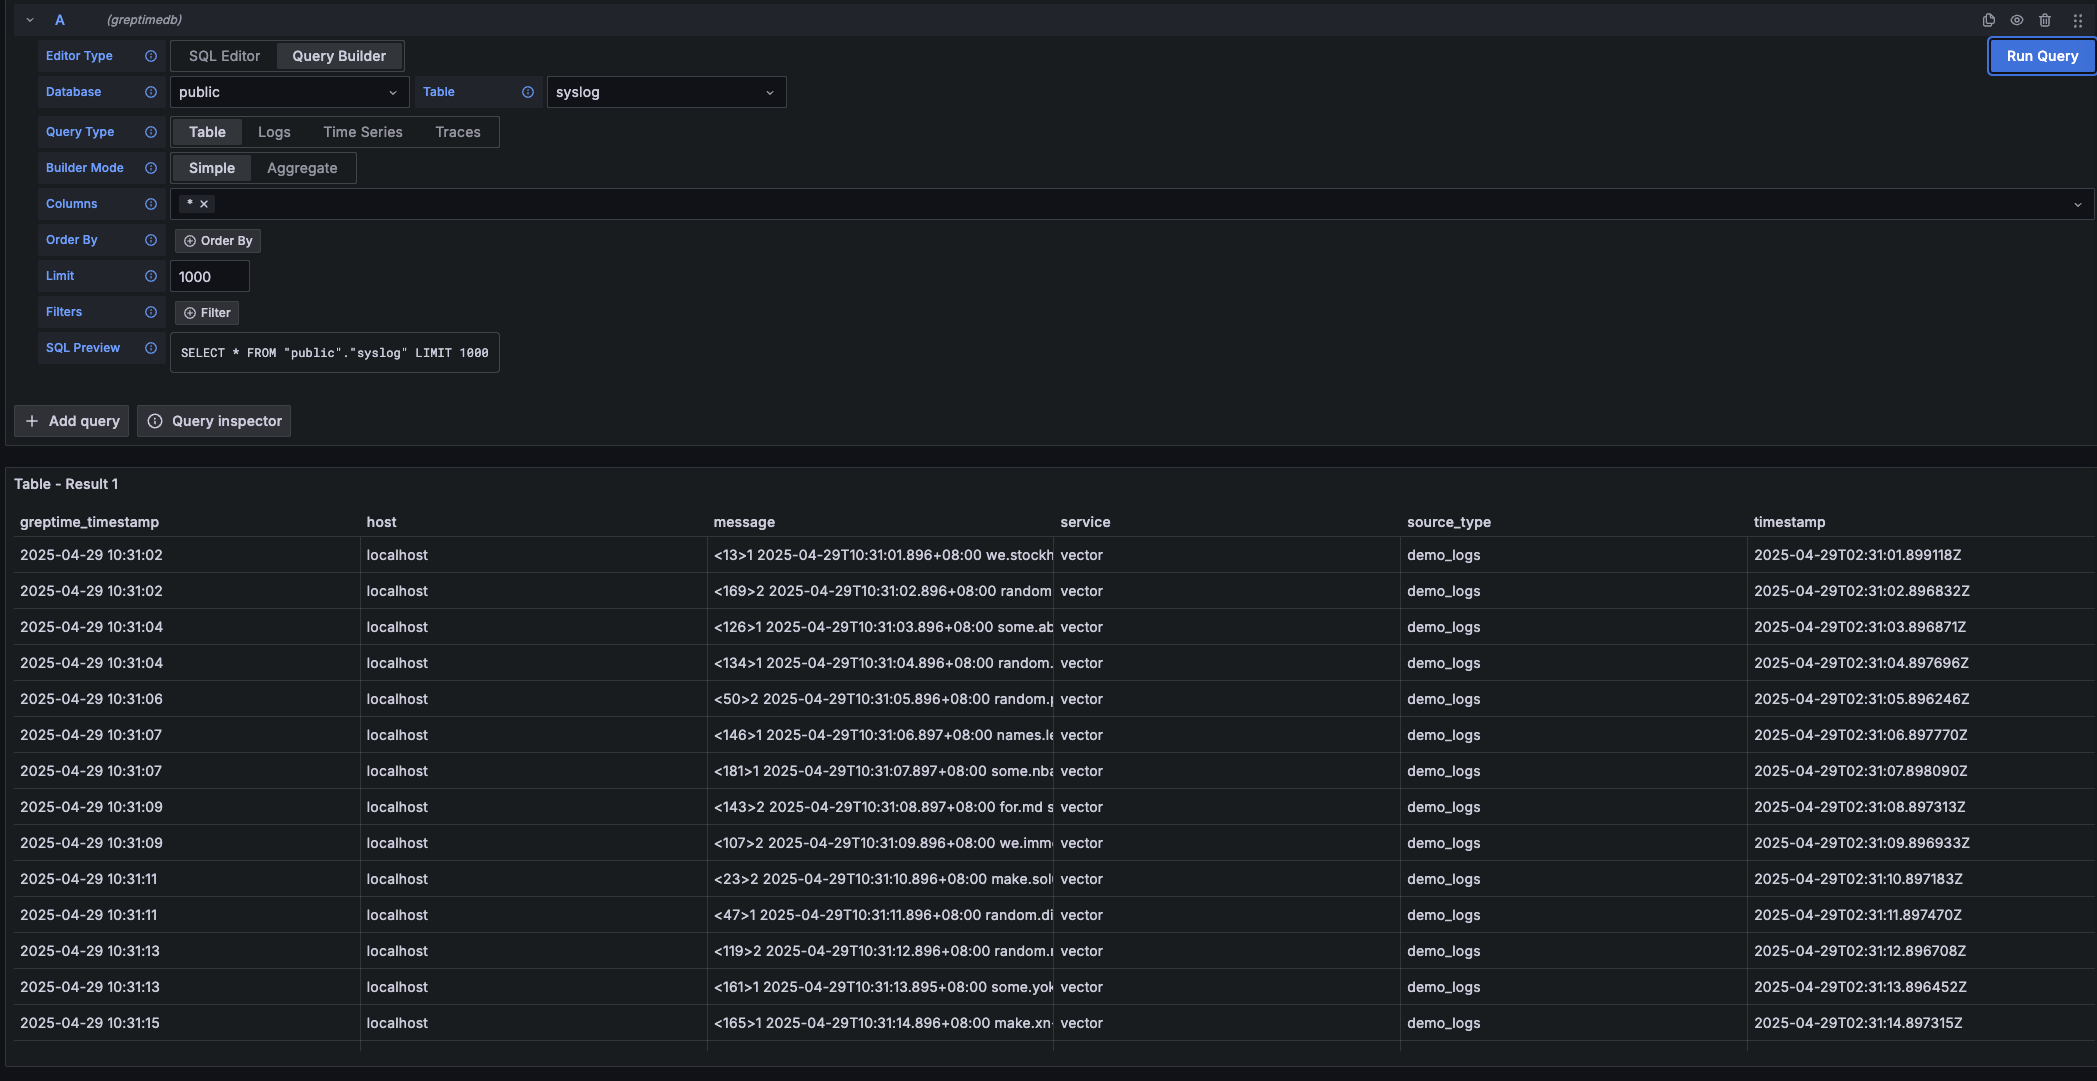
Table 查询
当查询结果不包含时间列时可以选择 Table 类型进行查询
| 设置项 | 对应值 |
|---|---|
| Columns | 选择要查询的列,可多选 |
| Filters | 设置筛选条件 |
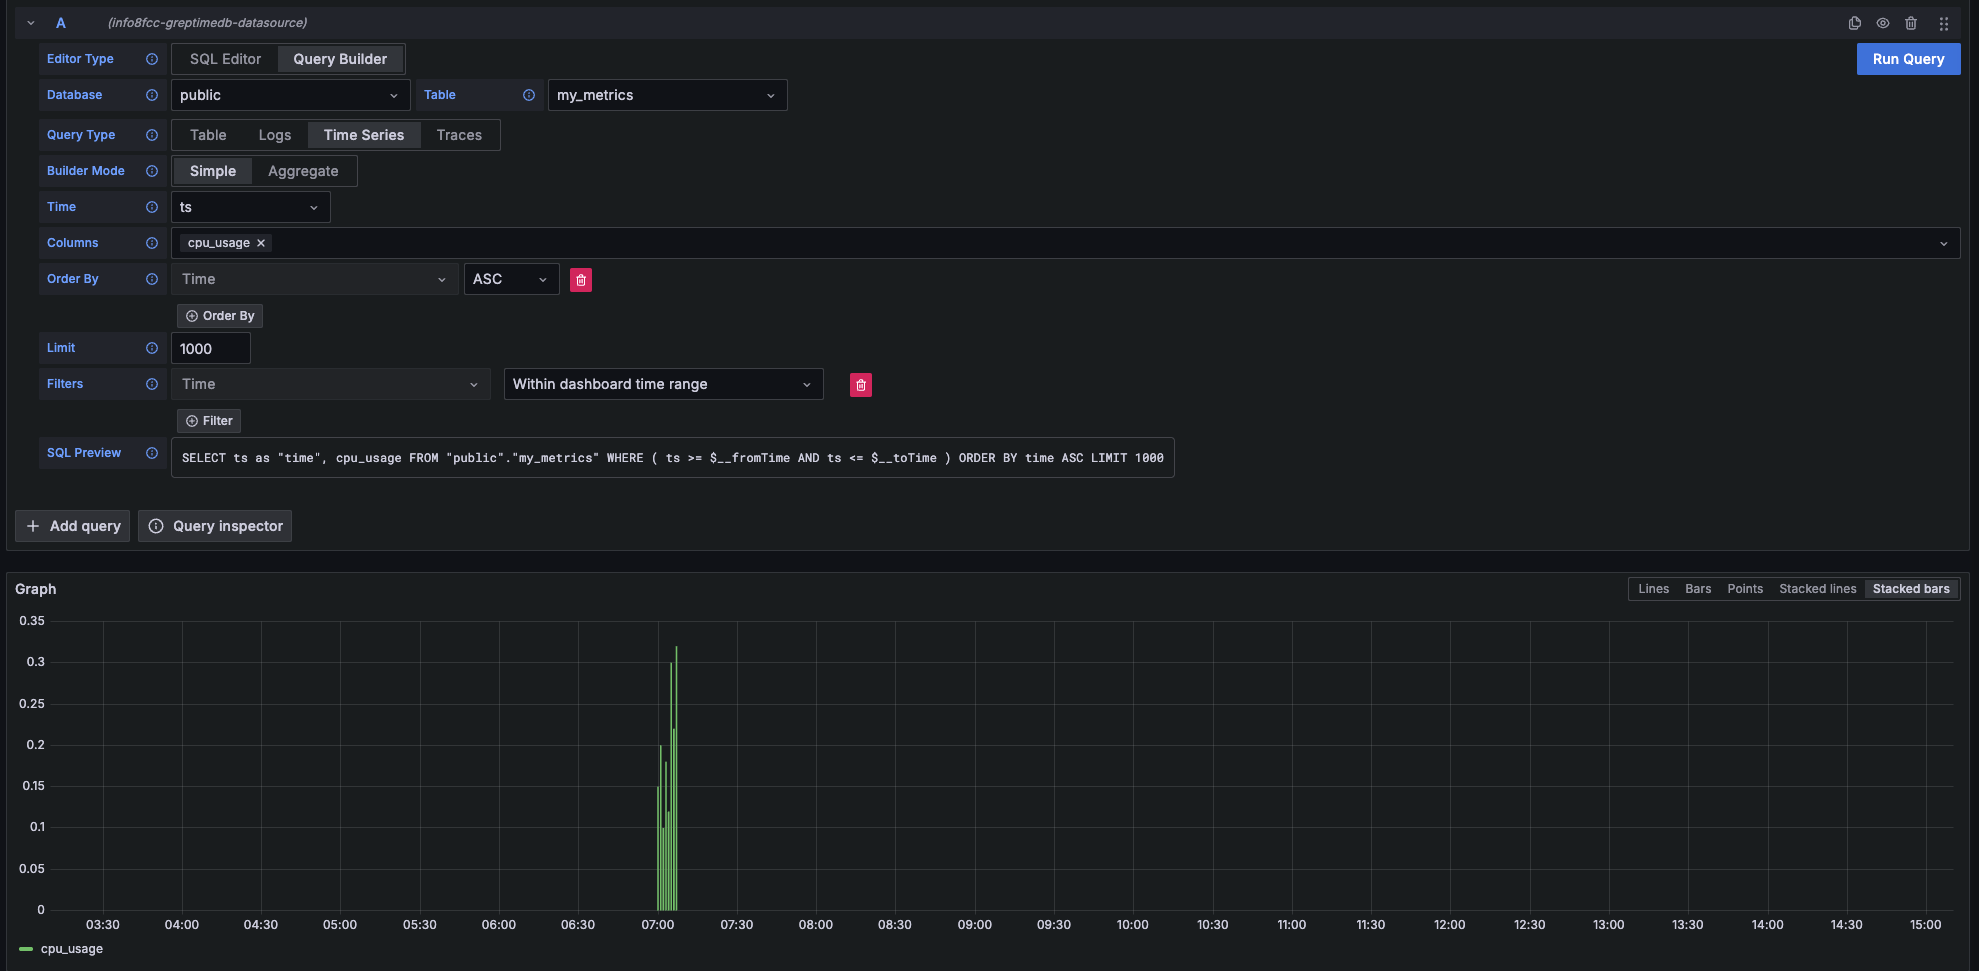
Metrics 查询
当查询结果包含时间列和数值列时可以选择 Time Series 类型进行查询
| 主要设置项 | 对应值 |
|---|---|
| Time | 选择时间列 |
| Columns | 选择数值列 |
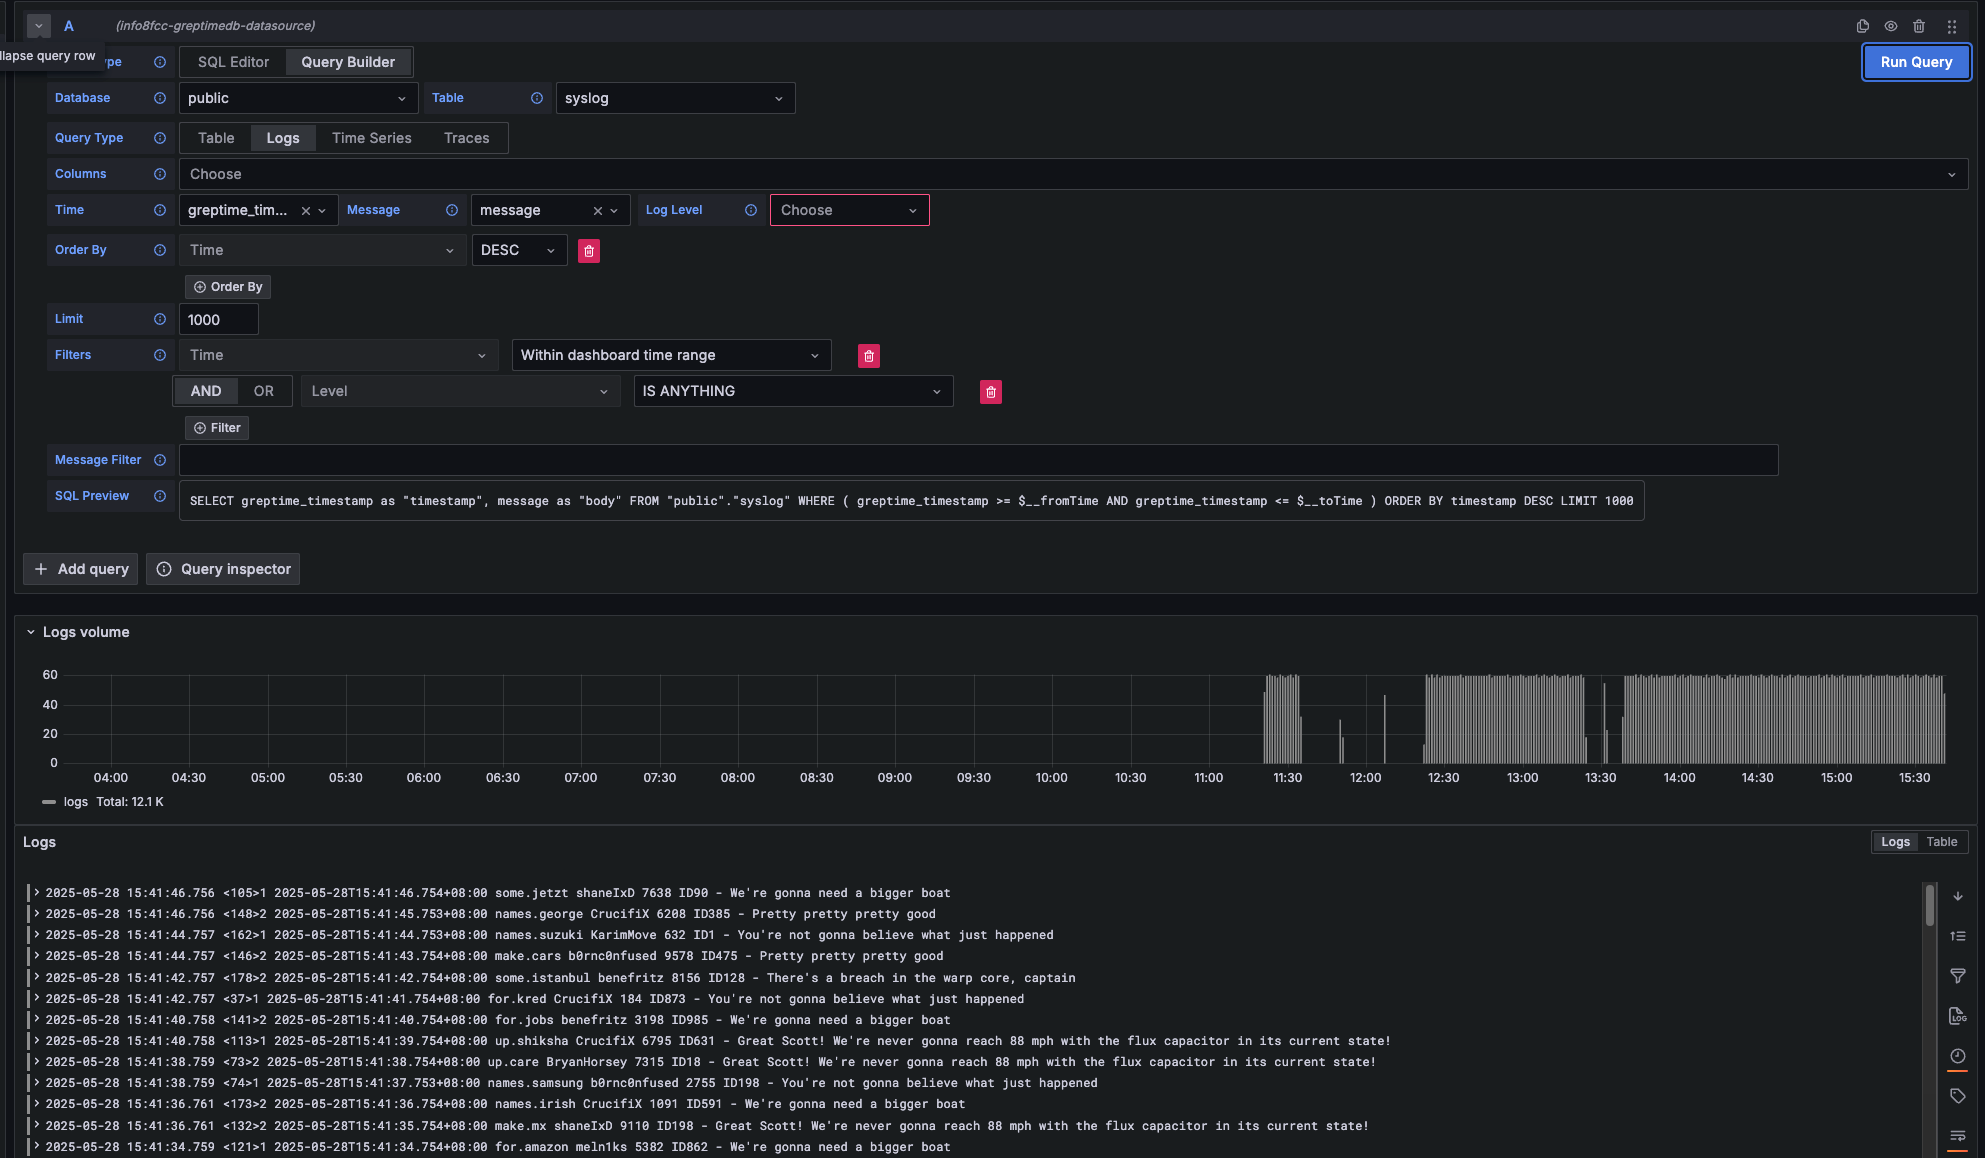
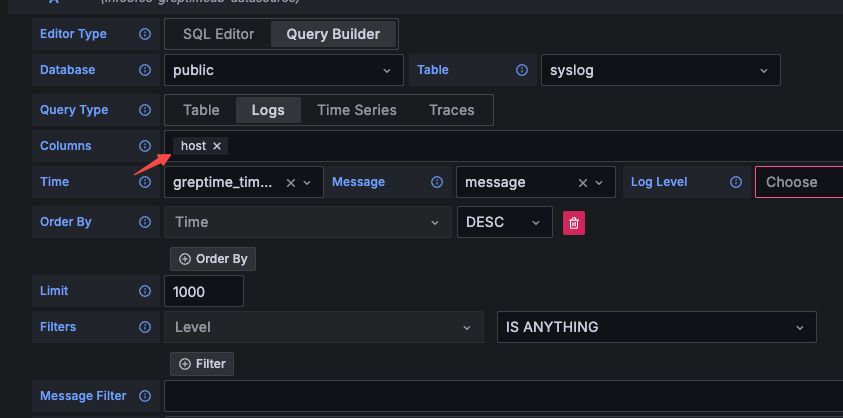
Logs 查询
当要查询 Logs 数据时选择 Logs 类型进行查询
- Logs: 对日志数据进行查询。需要设置
Time列和Message列。
| 主要设置项 | 对应值 |
|---|---|
| Time | 选择时间列 |
| Message | 选择日志内容列 |
| Log Level | 日志等级(非必填) |
logs Context 查询
根据日志行的 context 列的值进行近似时间范围查询
- 需要先设置 context 相关的列。
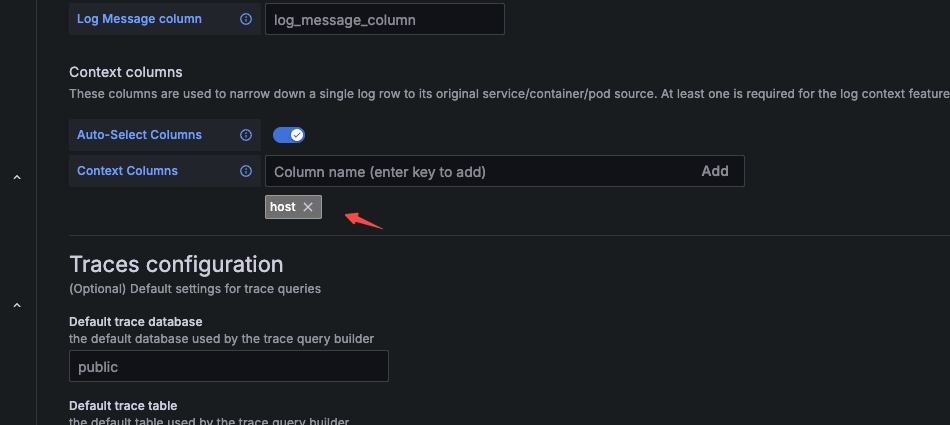
- 然后查询的时候包含 context 相关列。
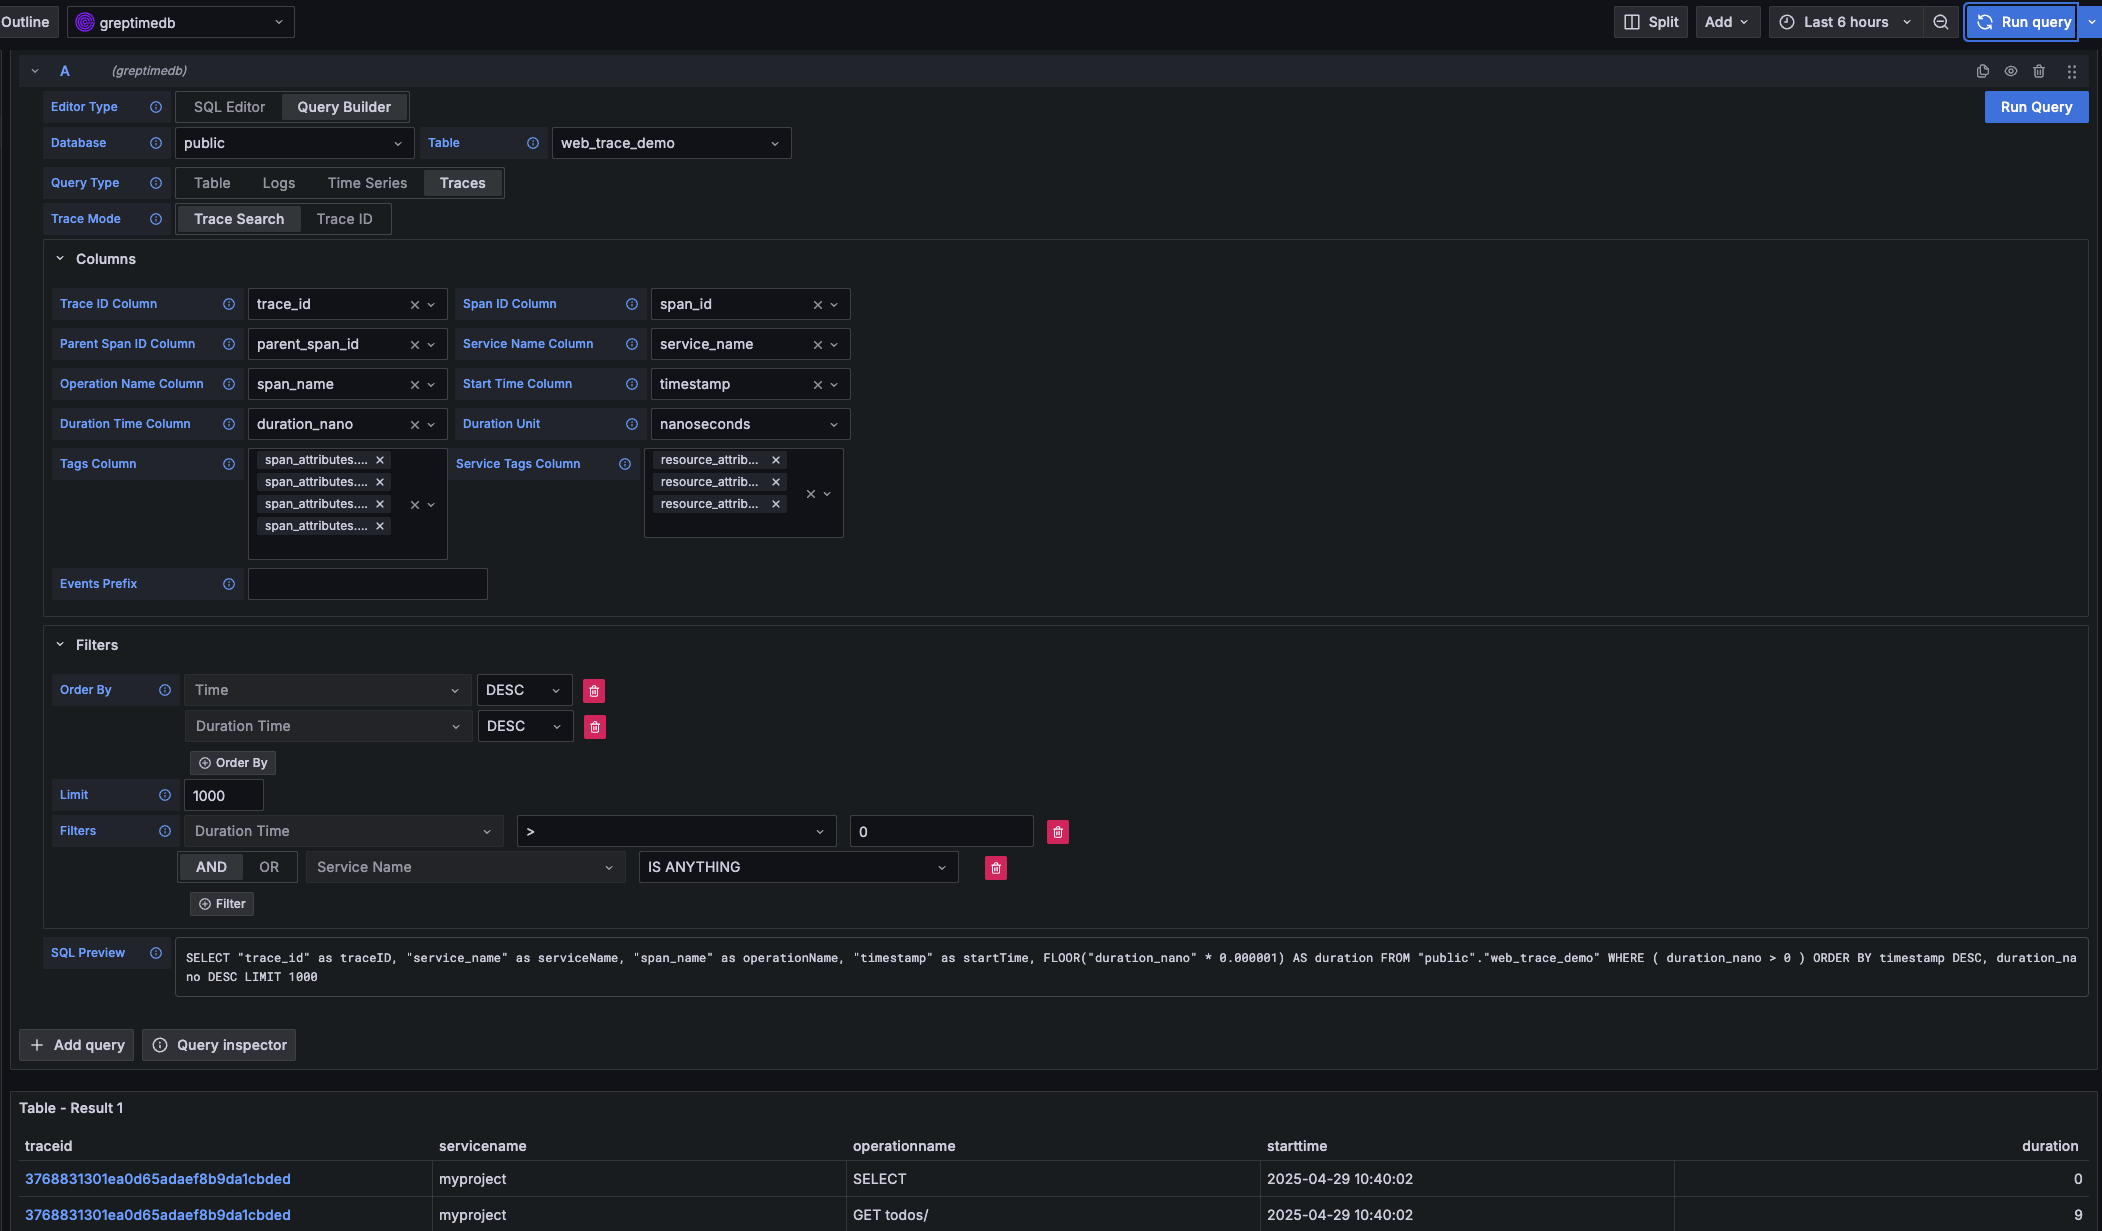
Traces 查询
当要查询 Traces 数据时选择 Traces 类型进行查询
| 主要设置项 | 对应值 |
|---|---|
| Trace Model | 选择 Trace Search 以查询 Trace 列表 |
| Trace Id Column | 初始值 trace_id |
| Span Id Column | 初始值 span_id |
| Parent Span ID Column | 初始值 parent_span_id |
| Service Name Column | 初始值 service_name |
| Operation Name Column | 初始值 span_name |
| Start Time Column | 初始值 timestamp |
| Duration Time Column | 初始值 duration_nano |
| Duration Unit | 初始值 nano_seconds |
| Tags Column | 可多选,对应以 span_attributes 开头的列 |
| Service Tags Column | 可多选,对应以 resource_attributes 开头的列 |
Prometheus 数据源
单击 Add data source 按钮,然后选择 Prometheus 作为类型。
在 HTTP 中填写 Prometheus server URL
http://<host>:4000/v1/prometheus
在 Auth 部分中单击 basic auth,并在 Basic Auth Details 中填写 GreptimeDB 的用户名和密码:
- User:
<username> - Password:
<password>
在 Custom HTTP Headers 部分中点击 Add header:
- Header:
x-greptime-db-name - Value:
<dbname>
然后单击 Save & Test 按钮以测试连接。
有关如何使用 PromQL 查询数据,请参阅 Prometheus 查询语言文档。
MySQL 数据源
单击 Add data source 按钮,然后选择 MySQL 作为类型。在 MySQL Connection 中填写以下信息:
- Host:
<host>:4002 - Database:
<dbname> - User:
<username> - Password:
<password> - Session timezone:
UTC
然后单击 Save & Test 按钮以测试连接。
注意目前我们只能使用 raw SQL 创建 Grafana Panel。由于时间戳数据类型的区别,Grafana 的 SQL Builder 暂时无法选择时间戳字段。
关于如何用 SQL 查询数据,请参考使用 SQL 查询数据文档。