SQL
GreptimeDB 在查询数据时支持完整的 SQL 语法。
在这篇文档中,我们将使用 monitor 表中的数据作为示例来演示如何查询数据。关于如何创建 monitor 表格并向其中插入数据,请参考表管理和写入数据。
基础查询
通过 SELECT 语句来查询数据。例如,下面的查询返回 monitor 表中的所有数据:
SELECT * FROM monitor;
查询结果如下:
+-----------+---------------------+------+--------+
| host      | ts                  | cpu  | memory |
+-----------+---------------------+------+--------+
| 127.0.0.1 | 2022-11-03 03:39:57 |  0.1 |    0.4 |
| 127.0.0.1 | 2022-11-03 03:39:58 |  0.5 |    0.2 |
| 127.0.0.2 | 2022-11-03 03:39:58 |  0.2 |    0.3 |
+-----------+---------------------+------+--------+
3 rows in set (0.00 sec)
SELECT 字段列表中也支持使用函数。
例如,你可以使用 count() 函数来获取表中的总行数:
SELECT count(*) FROM monitor;
+-----------------+
| COUNT(UInt8(1)) |
+-----------------+
|               3 |
+-----------------+
使用函数 avg() 返回某个字段的平均值:
SELECT avg(cpu) FROM monitor;
+---------------------+
| AVG(monitor.cpu)    |
+---------------------+
| 0.26666666666666666 |
+---------------------+
1 row in set (0.00 sec)
你还可以只返回函数的结果,例如从时间戳中提取一年中的第几天。
SQL 语句中的 DOY 是 day of the year 的缩写:
SELECT date_part('DOY', '2021-07-01 00:00:00');
结果:
+----------------------------------------------------+
| date_part(Utf8("DOY"),Utf8("2021-07-01 00:00:00")) |
+----------------------------------------------------+
|                                                182 |
+----------------------------------------------------+
1 row in set (0.003 sec)
时间函数的参数和结果与 SQL 客户端的时区保持一致。
例如,当客户端的时区设置为 +08:00 时,下面两个查询的结果是相同的:
select to_unixtime('2024-01-02 00:00:00');
select to_unixtime('2024-01-02 00:00:00+08:00');
请参考 SELECT 和 Functions 获取更多信息。
限制返回的行数
时间序列数据通常是海量的。
为了节省带宽和提高查询性能,你可以使用 LIMIT 语句来限制 SELECT 语句返回的行数。
例如,下面的查询限制返回的行数为 10:
SELECT * FROM monitor LIMIT 10;
过滤数据
你可以使用 WHERE 子句来过滤 SELECT 语句返回的行。
时序数据库中常见的场景是按照标签或时间索引来过滤数据。
例如,按照标签 host 来过滤数据:
SELECT * FROM monitor WHERE host='127.0.0.1';
按照时间索引 ts 来过滤数据,返回 2022-11-03 03:39:57 之后的数据:
SELECT * FROM monitor WHERE ts > '2022-11-03 03:39:57';
你可以使用 AND 关键字来组合多个约束条件:
SELECT * FROM monitor WHERE host='127.0.0.1' AND ts > '2022-11-03 03:39:57';
使用时间索引过滤数据
按照时间索引来过滤数据是时序数据库的一个关键特性。
当处理 Unix 时间值时,数据库会默认将其类型认定为相关列的值类型。
例如,当 monitor 表中的 ts 列的值类型为 TimestampMillisecond 时,
你可以使用下面的查询来过滤数据:
Unix 时间值 1667446797000 表示一个以毫秒为单位的时间戳。
SELECT * FROM monitor WHERE ts > 1667446797000;
当处理时间精度为非默认类型的 Unix 时间值时,你需要使用 :: 语法来指定时间的类型。
这样可以确保数据库正确地识别时间的类型。
例如 1667446797 表示一个以秒为单位的时间戳,不是 ts 列默认的毫秒时间戳。
你需要使用 ::TimestampSecond 语法来指定它的类型为 TimestampSecond 来告知数据库 1667446797 应该被视为以秒为单位的时间戳。
SELECT * FROM monitor WHERE ts > 1667446797::TimestampSecond;
请参考数据类型 获取更多时间类型。
对于标准的 RFC3339 或 ISO8601 字符串,由于其具备明确的精度,你可以直接在过滤条件中使用它们:
SELECT * FROM monitor WHERE ts > '2022-07-25 10:32:16.408';
你还可以使用时间函数来过滤数据。
例如,使用 now() 函数和 INTERVAL 关键字来获取最近 5 分钟的数据:
SELECT * FROM monitor WHERE ts >= now() - '5 minutes'::INTERVAL;
请参考 Functions 获取更多时间函数信息。
时区
GreptimeDB 的 SQL 客户端会根据本地时区解释不带时区信息的字符串时间戳。
例如,当客户端时区为 +08:00 时,下面的两个查询是相同的:
SELECT * FROM monitor WHERE ts > '2022-07-25 10:32:16.408';
SELECT * FROM monitor WHERE ts > '2022-07-25 10:32:16.408+08:00';
查询结果中的时间戳列值会根据客户端时区格式化。
例如,下面的代码展示了相同的 ts 值在客户端时区 UTC 和 +08:00 下的结果:
- timezone UTC
- timezone +08:00
+-----------+---------------------+------+--------+
| host      | ts                  | cpu  | memory |
+-----------+---------------------+------+--------+
| 127.0.0.1 | 2023-12-31 16:00:00 |  0.5 |    0.1 |
+-----------+---------------------+------+--------+
+-----------+---------------------+------+--------+
| host      | ts                  | cpu  | memory |
+-----------+---------------------+------+--------+
| 127.0.0.1 | 2024-01-01 00:00:00 |  0.5 |    0.1 |
+-----------+---------------------+------+--------+
函数
GreptimeDB 提供了丰富的内置函数和聚合函数,为数据分析应用开发。其特点包括:
- Apache Datafusion 查询引擎中继承的函数,包括一组符合 Postgres 命名方式和行为的日期/时间函数。
- JSON、位置信息等特殊数据类型的操作函数。
- 高级全文匹配能力。
查看 函数列表。
排序
GreptimeDB 不保证返回数据的顺序。你需要使用 ORDER BY 子句来对返回的数据进行排序。
例如,在时间序列场景中通常使用时间索引列作为排序键:
-- ascending order by ts
SELECT * FROM monitor ORDER BY ts ASC;
-- descending order by ts
SELECT * FROM monitor ORDER BY ts DESC;
远程动态过滤下推
GreptimeDB 默认会为分布式 SQL 查询启用远程动态过滤下推。
它主要用于分布式 Join 查询。
当 Join 的一侧在运行时构建出动态过滤条件时,Frontend 可以将该过滤条件传播到 Datanode,让另一侧的扫描更早地裁剪数据。
其他一些算子,例如 TopK(ORDER BY ... LIMIT),在符合条件的执行计划中也可能产生动态过滤条件。
这是一个尽力而为的性能优化,不会改变查询结果。 它只会在分布式查询计划中包含可发送到远端扫描的动态过滤条件时生效。 如果查询计划中没有动态过滤条件,或者该过滤条件无法被安全编码或应用,GreptimeDB 会在没有远程动态过滤下推的情况下执行查询。
要为单个 HTTP SQL 请求关闭该优化,可以将 query.enable_remote_dynamic_filter_pushdown hint 设置为 false:
curl -X POST \
-H 'Content-Type: application/x-www-form-urlencoded' \
-H 'x-greptime-hints: query.enable_remote_dynamic_filter_pushdown=false' \
--data-urlencode "sql=SELECT m.* FROM monitor m JOIN host_info h ON m.host = h.host WHERE h.region = 'us-west'" \
http://localhost:4000/v1/sql
该选项默认值为 true。
设置为 false 后,只会为当前查询关闭 Frontend 到 Datanode 的远程动态过滤传播。
当查询通过本地 Frontend 到 Datanode 的 region query 路径执行时,该选项也适用于 standalone 部署。
当前没有用于修改该默认值的持久化 Frontend 或 Datanode 配置项。
它不会关闭单个执行节点内部的本地动态过滤优化。
有关请求 hints 的更多信息,请参阅 HTTP hints。
CASE 表达式
你可以使用 CASE 表达式在查询中执行条件逻辑。
例如,下面的查询根据 cpu 字段的值返回 CPU 的状态:
SELECT
    host,
    ts,
    CASE
        WHEN cpu > 0.5 THEN 'high'
        WHEN cpu > 0.3 THEN 'medium'
        ELSE 'low'
    END AS cpu_status
FROM monitor;
结果如下:
+-----------+---------------------+------------+
| host      | ts                  | cpu_status |
+-----------+---------------------+------------+
| 127.0.0.1 | 2022-11-03 03:39:57 | low        |
| 127.0.0.1 | 2022-11-03 03:39:58 | medium     |
| 127.0.0.2 | 2022-11-03 03:39:58 | low        |
+-----------+---------------------+------------+
3 rows in set (0.01 sec)
更多信息请参考 CASE。
按标签聚合数据
你可以使用 GROUP BY 语句将具有相同值的行进行分组汇总,例如查询 idc 列中的所有不同值的内存均值:
SELECT host, avg(cpu) FROM monitor GROUP BY host;
+-----------+------------------+
| host      | AVG(monitor.cpu) |
+-----------+------------------+
| 127.0.0.2 |              0.2 |
| 127.0.0.1 |              0.3 |
+-----------+------------------+
2 rows in set (0.00 sec)
请参考 GROUP BY 获取更多相关信息。
查询时间线中的最新数据
你可以通过组合使用 DISTINCT ON 和 ORDER BY 来查询每条时间线的最新数据点,例如:
SELECT DISTINCT ON (host) * FROM monitor ORDER BY host, ts DESC;
+-----------+---------------------+------+--------+
| host      | ts                  | cpu  | memory |
+-----------+---------------------+------+--------+
| 127.0.0.1 | 2022-11-03 03:39:58 |  0.5 |    0.2 |
| 127.0.0.2 | 2022-11-03 03:39:58 |  0.2 |    0.3 |
+-----------+---------------------+------+--------+
2 rows in set (0.00 sec)
按时间窗口聚合数据
GreptimeDB 支持 Range Query 来按时间窗口聚合数据。
假设我们有以下数据在 monitor 表 中:
+-----------+---------------------+------+--------+
| host      | ts                  | cpu  | memory |
+-----------+---------------------+------+--------+
| 127.0.0.1 | 2023-12-13 02:05:41 |  0.5 |    0.2 |
| 127.0.0.1 | 2023-12-13 02:05:46 | NULL |   NULL |
| 127.0.0.1 | 2023-12-13 02:05:51 |  0.4 |    0.3 |
| 127.0.0.2 | 2023-12-13 02:05:41 |  0.3 |    0.1 |
| 127.0.0.2 | 2023-12-13 02:05:46 | NULL |   NULL |
| 127.0.0.2 | 2023-12-13 02:05:51 |  0.2 |    0.4 |
+-----------+---------------------+------+--------+
下面的查询返回 10 秒内的平均 CPU 使用率,并且每 5 秒计算一次:
SELECT
    ts,
    host,
    avg(cpu) RANGE '10s' FILL LINEAR
FROM monitor
ALIGN '5s' TO '2023-12-01T00:00:00' BY (host) ORDER BY ts ASC;
avg(cpu) RANGE '10s' FILL LINEAR是一个 Range 表达式。RANGE '10s'指定了聚合的时间范围为 10s,FILL LINEAR指定了如果某个点没有数据,使用LINEAR方法来填充。ALIGN '5s'指定了查询的步频为 5s。TO '2023-12-01T00:00:00指定了原始对齐时间。默认值为 Unix 时间 0。BY (host)指定了聚合的键。如果省略BY关键字,那么默认使用数据表的主键作为聚合键。ORDER BY ts ASC指定了结果集的排序方法。如果不指定排序方法,结果集的顺序是不确定的。
查询结果如下:
+---------------------+-----------+----------------------------------------+
| ts                  | host      | AVG(monitor.cpu) RANGE 10s FILL LINEAR |
+---------------------+-----------+----------------------------------------+
| 2023-12-13 02:05:35 | 127.0.0.1 |                                    0.5 |
| 2023-12-13 02:05:40 | 127.0.0.1 |                                    0.5 |
| 2023-12-13 02:05:45 | 127.0.0.1 |                                    0.4 |
| 2023-12-13 02:05:50 | 127.0.0.1 |                                    0.4 |
| 2023-12-13 02:05:35 | 127.0.0.2 |                                    0.3 |
| 2023-12-13 02:05:40 | 127.0.0.2 |                                    0.3 |
| 2023-12-13 02:05:45 | 127.0.0.2 |                                    0.2 |
| 2023-12-13 02:05:50 | 127.0.0.2 |                                    0.2 |
+---------------------+-----------+----------------------------------------+
时间范围窗口
将初始时间范围窗口在时间序列中向前和向后移动,就生成了所有时间范围窗口。
在上面的例子中,初始对齐时间被设置为 2023-12-01T00:00:00,这也是初始时间窗口的结束时间。
RANGE 选项和初始对齐时间定义了初始时间范围窗口,它从 初始对齐时间 开始,到 初始对齐时间 + RANGE 结束。
ALIGN 选项定义了查询的步频,决定了从初始时间窗口到其他时间窗口的计算步频。
例如,使用初始对齐时间 2023-12-01T00:00:00 和 ALIGN '5s',时间窗口的对齐时间为 2023-11-30T23:59:55、2023-12-01T00:00:00、2023-12-01T00:00:05、2023-12-01T00:00:10 等。
这些时间窗口是左闭右开区间,满足条件 [对齐时间, 对齐时间 + 范围)。
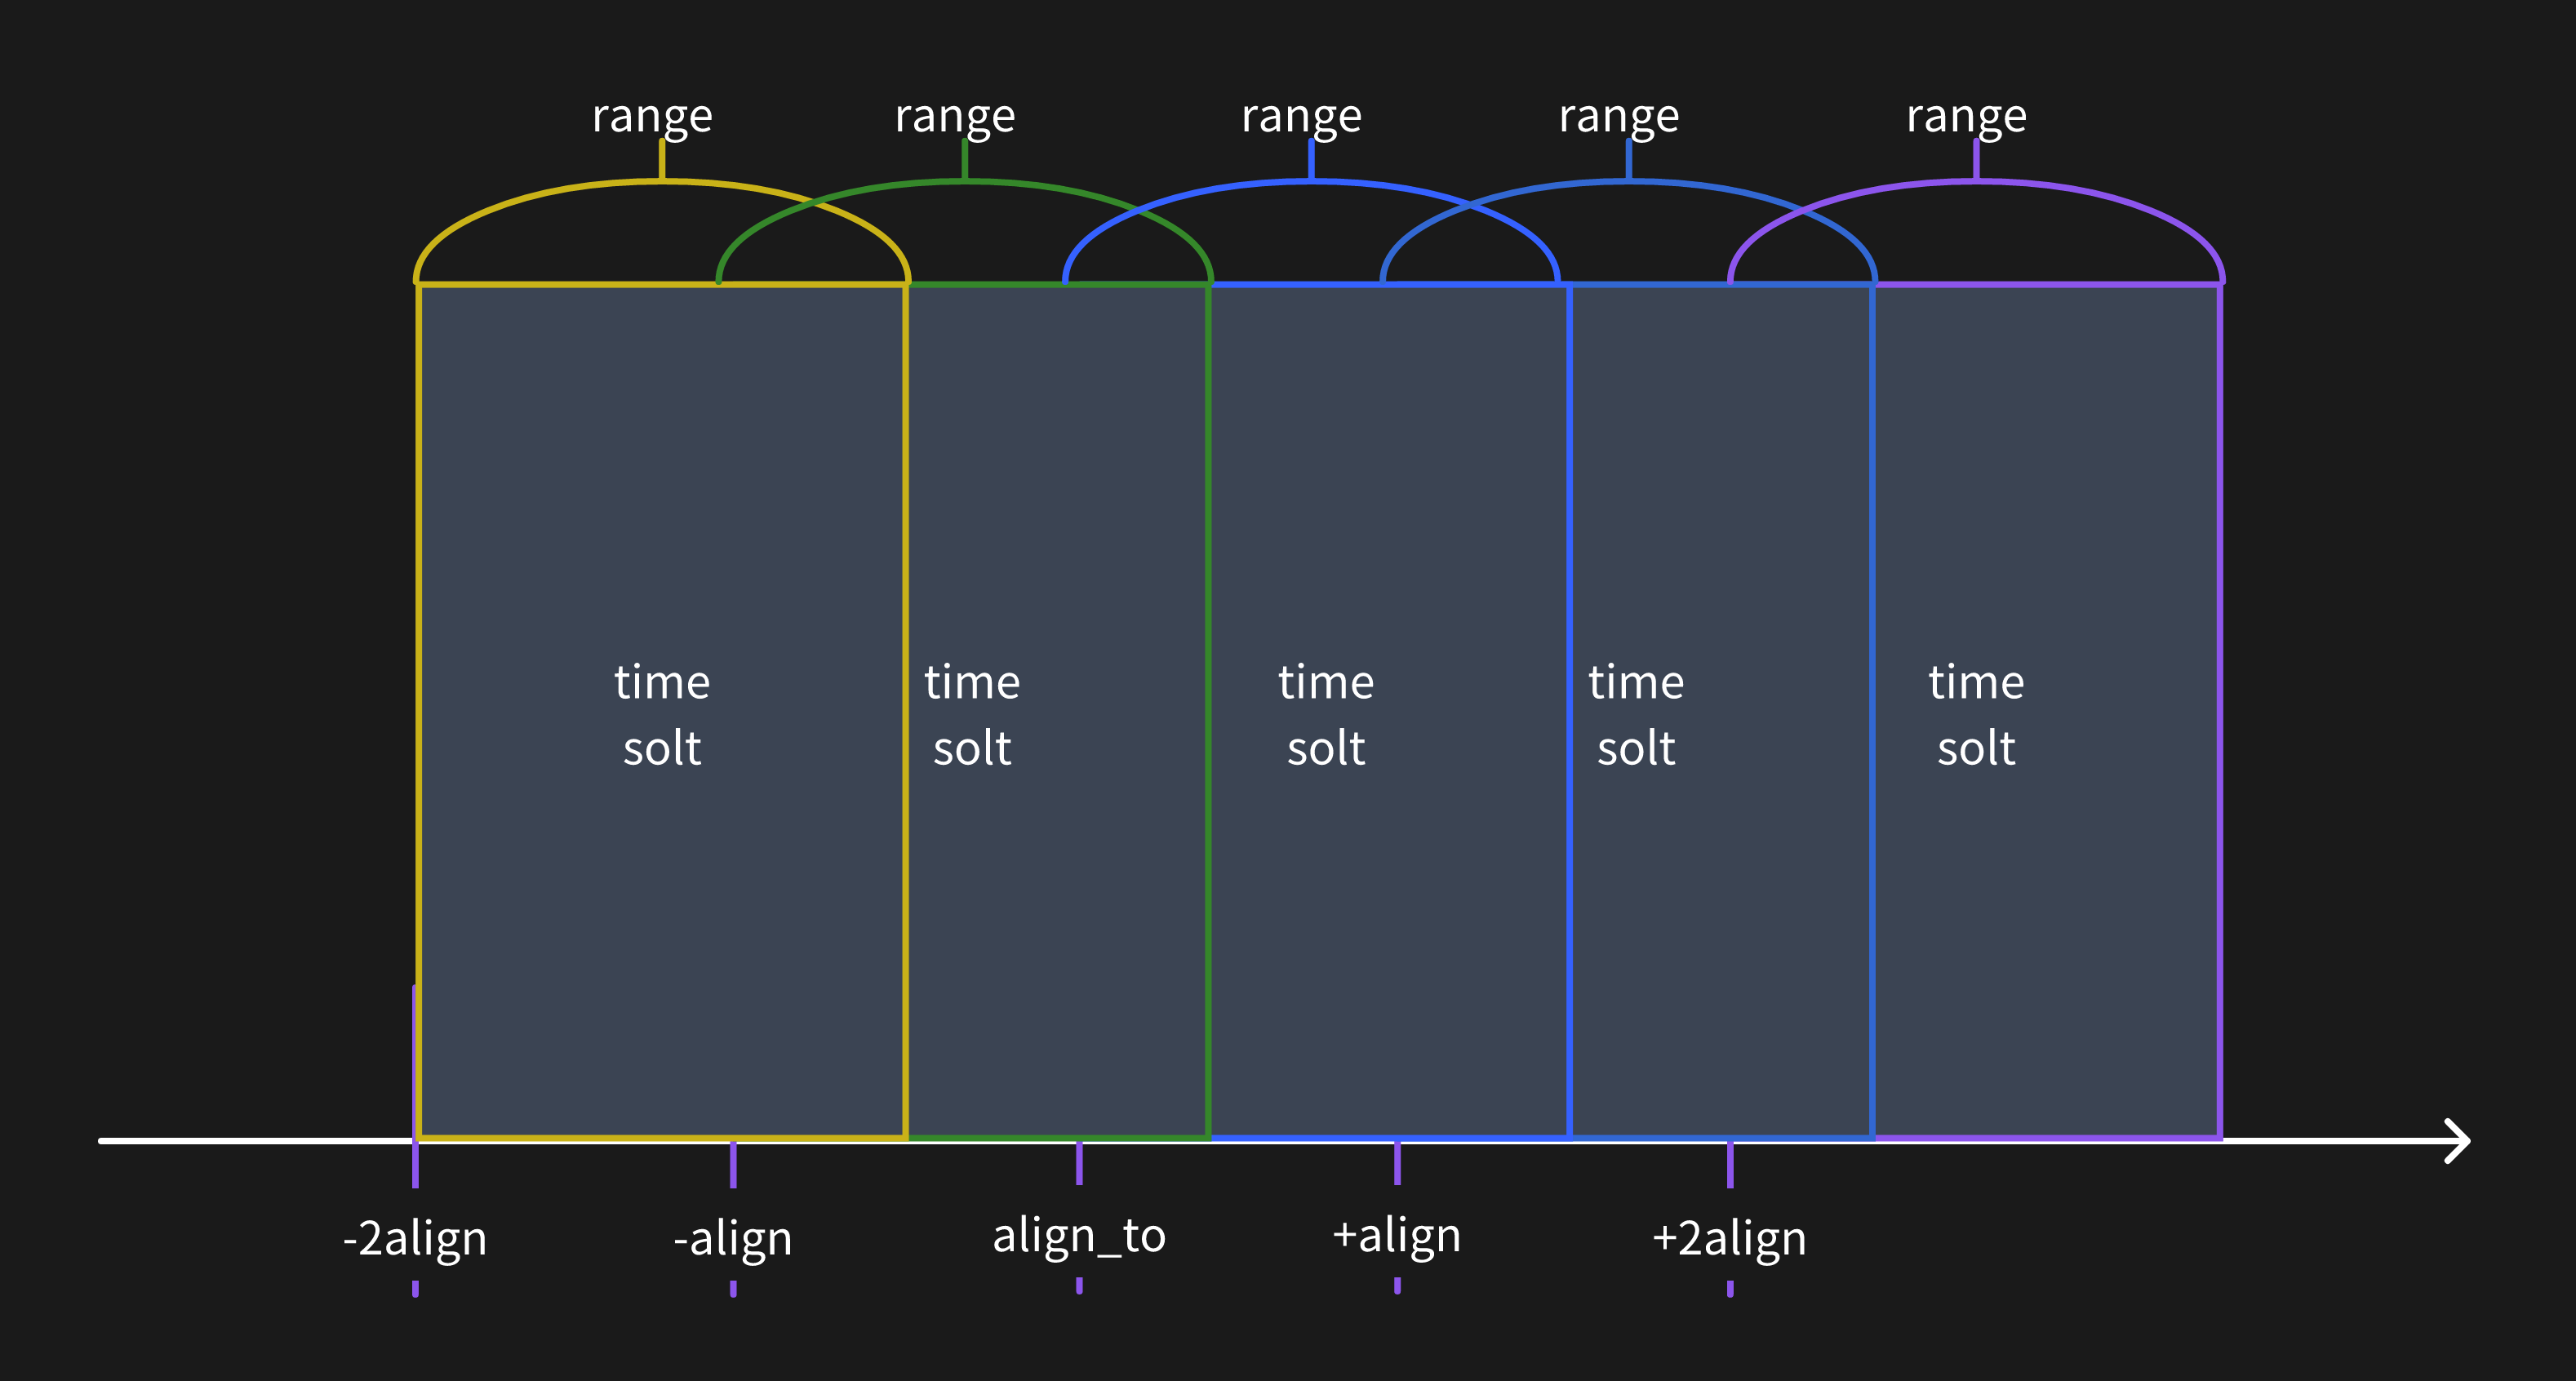
下方的图片可以帮助你更直观的理解时间范围窗口:
当查询的步频大于时间范围窗口时,数据将只会被计算在一个时间范围窗口中。
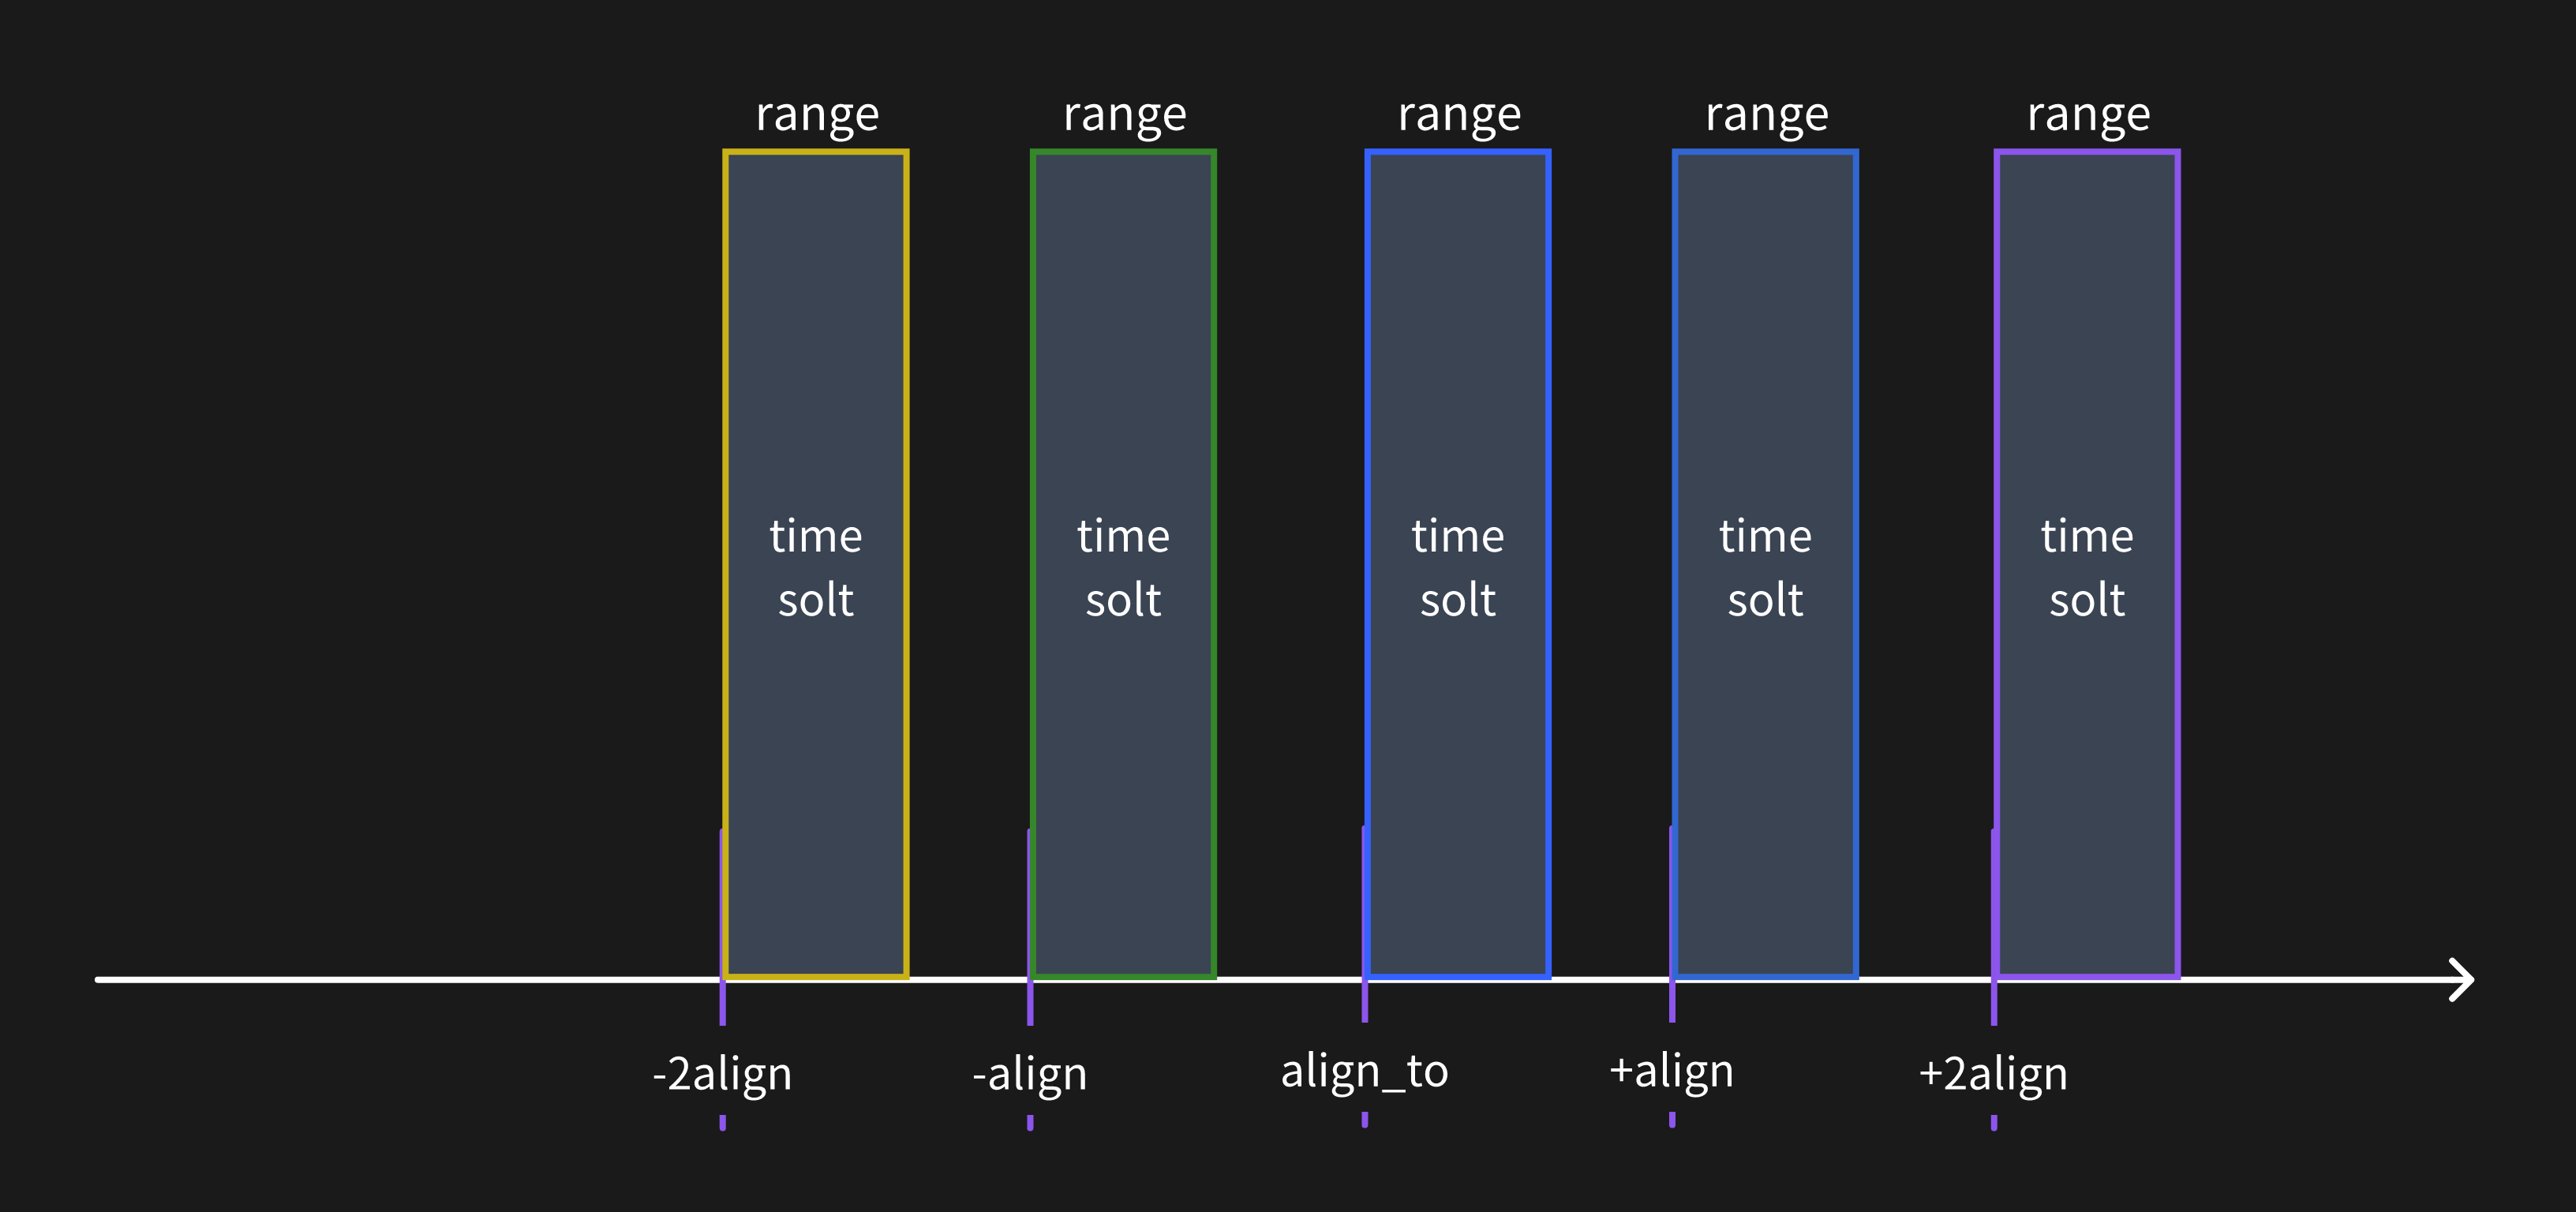
当查询的步频小于时间范围窗口时,数据将会被计算在多个时间范围窗口中。
对齐到特定时间戳
对齐时间默认基于当前 SQL 客户端会话的时区。
你可以将初始对齐时间设置为任何你想要的时间戳。例如,使用 NOW 将对齐到当前时间:
SELECT
    ts,
    host,
    avg(cpu) RANGE '1w'
FROM monitor
ALIGN '1d' TO NOW BY (host);
或者使用 ISO 8601 时间戳将对齐到指定时间:
SELECT
    ts,
    host,
    avg(cpu) RANGE '1w'
FROM monitor
ALIGN '1d' TO '2023-12-01T00:00:00+08:00' BY (host);
填充空值
FILL 选项可以用来填充数据中的空值。
例如上面的例子使用了 LINEAR 方法来填充空值。
该选项也支持其他填充空值的方法,例如 PREV 和常量值 X,更多信息请参考 FILL OPTION。
语法
请参考 Range Query 获取更多信息。
表名约束
如果你的表名包含特殊字符或大写字母,需要将表名用反引号括起来。 有关示例,请参阅表创建表文档中的表名约束部分。
HTTP API
在 HTTP 请求中使用 POST 方法来查询数据:
curl -X POST \
  -H 'authorization: Basic <base64-encoded-credentials>' \
  -H 'Content-Type: application/x-www-form-urlencoded' \
  -d 'sql=select * from monitor' \
http://localhost:4000/v1/sql?db=public
结果如下:
{
  "code": 0,
  "output": [
    {
      "records": {
        "schema": {
          "column_schemas": [
            {
              "name": "host",
              "data_type": "String"
            },
            {
              "name": "ts",
              "data_type": "TimestampMillisecond"
            },
            {
              "name": "cpu",
              "data_type": "Float64"
            },
            {
              "name": "memory",
              "data_type": "Float64"
            }
          ]
        },
        "rows": [
          ["127.0.0.1", 1667446797450, 0.1, 0.4],
          ["127.0.0.1", 1667446798450, 0.5, 0.2],
          ["127.0.0.2", 1667446798450, 0.2, 0.3]
        ]
      }
    }
  ],
  "execution_time_ms": 0
}
请参考 API 文档获取更详细的 HTTP 请求的内容。