持续性能剖析
管理控制台的持续性能剖析(Continuous Profiling)可以监控 GreptimeDB 各组件的资源使用情况,并将 pprof 格式的内存和 CPU Profile 存储到监控用的 GreptimeDB 实例中。该功能可以帮助运维人员排查内存增长、高 CPU 使用率和性能回退问题,而无需手动登录到每个组件所在节点。
持续性能剖析 UI 从 dashboard 版本 v0.2.0-alpha.8 开始可用。
持续性能剖析在 dashboard apiserver 中配置,并以集群为粒度工作。启用后,监控器会扫描来自集群指标的组件序列,首先采集首次发现的组件;后续当资源使用量按配置的步长增长,或超过配置阈值后达到新的高水位时,再采集新的 Profile。
内存 Profile
在 dashboard apiserver 配置中启用内存 Profile 监控:
monitoring:
  greptimedb:
    url: http://monitoring-greptimedb:4000
  memory_profile:
    enabled: true
    memory_profiles_database: public
    memory_profiles_table: _gt_memory_profiles
    memory_profile_step_mb: 100
    high_memory_threshold_mb: 1024
内存 Profile 配置项:
enabled:启用或禁用内存 Profile 监控。memory_profiles_database:存储内存 Profile 的数据库,默认值为public。memory_profiles_table:存储内存 Profile 的表,默认值为_gt_memory_profiles。memory_profile_step_mb:内存增长步长,单位为 MB。首次采集后,内存使用量每增长该步长会触发一次新的 Profile 采集。high_memory_threshold_mb:高内存阈值,单位为 MB。内存使用量超过该值后,每次达到新的内存高水位都会触发 Profile 采集。设置为0可禁用高内存采集。
Profile 表默认是 public._gt_memory_profiles,创建时默认 TTL 为 30 天。监控器会根据内存使用量、内存限制和进程启动时间指标判断何时采集新的 Profile。
目标 GreptimeDB 进程必须在启动时启用 jemalloc 内存 Profile,具体要求见 Memory profiling。对于 Linux 上的命令行部署,可以使用 MALLOC_CONF=prof:true 启动进程:
MALLOC_CONF=prof:true ./greptime standalone start
对于 Helm 部署,可以将该环境变量添加到目标 Role,或添加到 base.podTemplate.main.env 以应用到所有 GreptimeDB Role:
base:
  podTemplate:
    main:
      env:
        - name: MALLOC_CONF
          value: "prof:true"
管理控制台会以列表形式展示已采集的内存 Profile,并支持按 Pod、App、Role 和时间范围筛选。需要按需采集组件 Profile 时,可以使用 Capture。
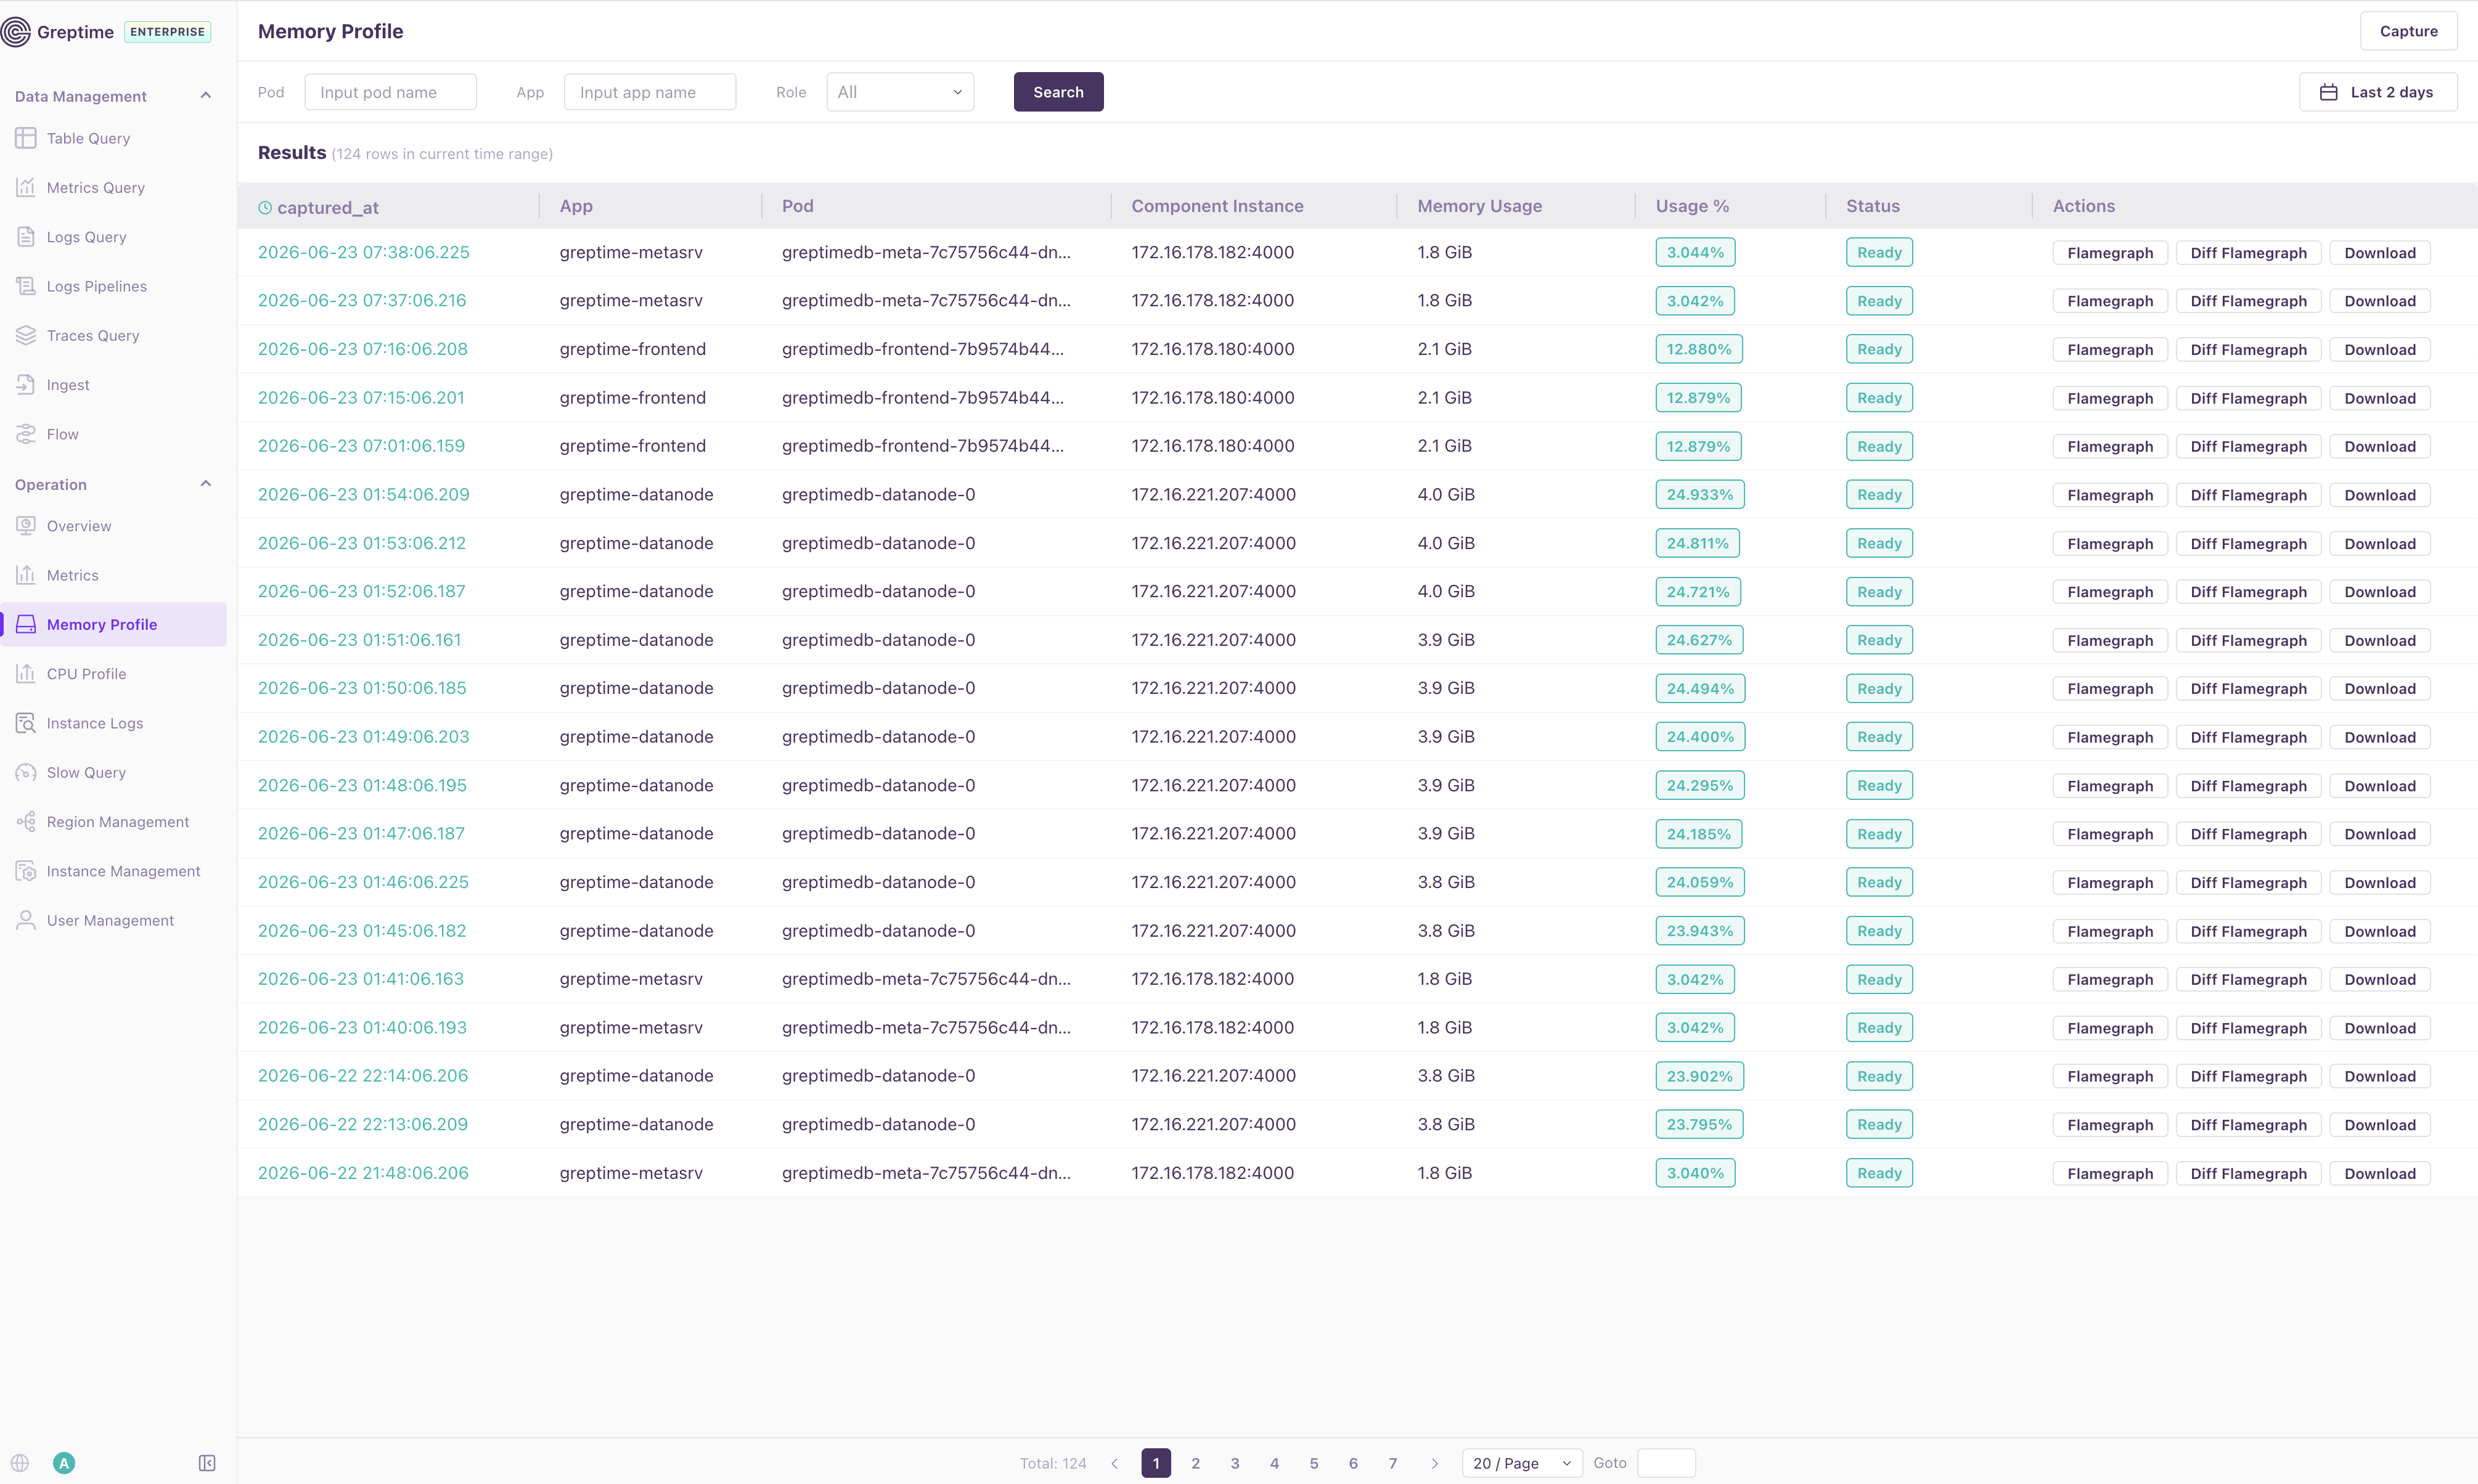
列表会展示 Profile 的采集时间、组件 App 和 Pod、组件端点、内存用量、使用率以及 Profile 状态。你可以通过行内操作打开火焰图、与 base Profile 进行对比,或下载原始 pprof 文件用于离线分析。
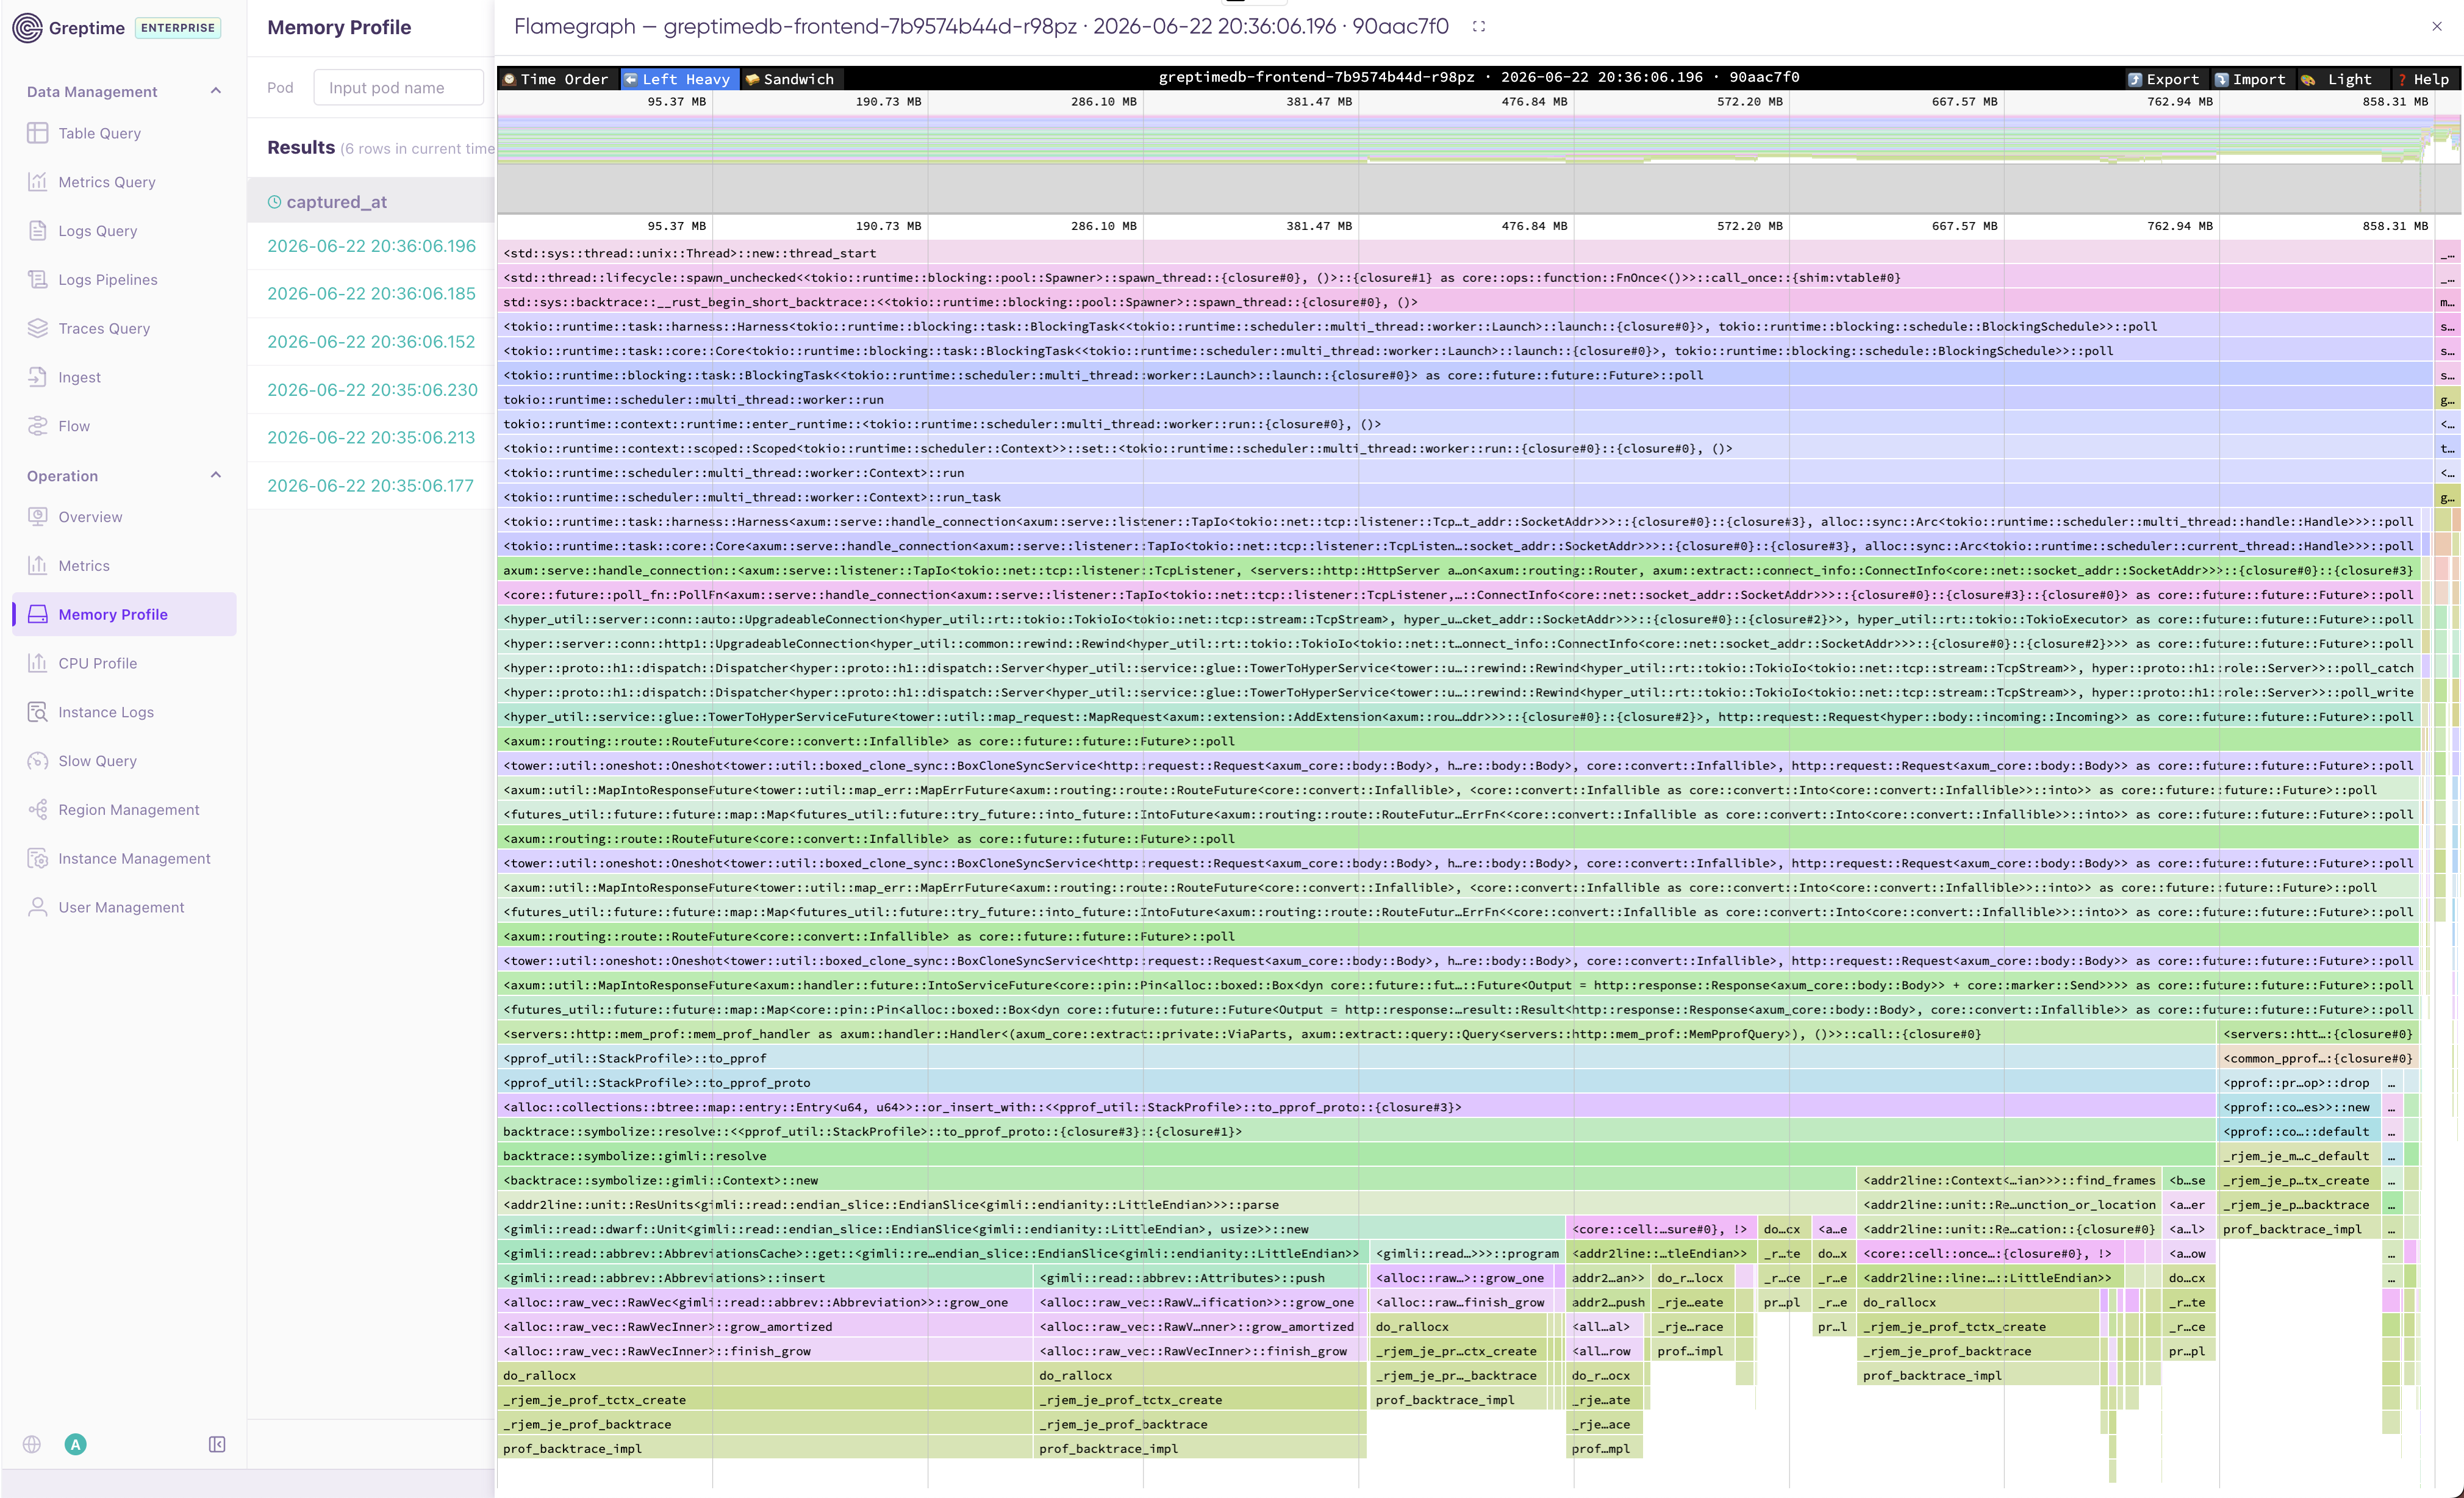
火焰图视图会在浏览器中渲染已采集的 Profile。顶部工具栏支持常见 pprof 交互,例如排序、在 Left Heavy 和 Sandwich 视图间切换、导入导出 Profile 数据,以及调整展示主题。
CPU Profile
在 dashboard apiserver 配置中启用 CPU Profile 监控:
monitoring:
  greptimedb:
    url: http://monitoring-greptimedb:4000
  cpu_profile:
    enabled: true
    cpu_profiles_database: public
    cpu_profiles_table: _gt_cpu_profiles
    cpu_profile_step_millicores: 100
    high_cpu_threshold_millicores: 800
    seconds: 5
    frequency: 99
CPU Profile 配置项:
enabled:启用或禁用 CPU Profile 监控。cpu_profiles_database:存储 CPU Profile 的数据库,默认值为public。cpu_profiles_table:存储 CPU Profile 的表,默认值为_gt_cpu_profiles。cpu_profile_step_millicores:CPU 使用量增长步长,单位为 millicores。首次采集后,CPU 使用量每增长该步长会触发一次新的 Profile 采集。high_cpu_threshold_millicores:高 CPU 阈值,单位为 millicores。CPU 使用量超过该值后,每次达到新的 CPU 高水位都会触发 Profile 采集。设置为0可禁用高 CPU 采集。seconds:每次 CPU Profile 采集的持续时间,单位为秒。frequency:CPU Profile 的采样频率,单位为 Hz。
Profile 表默认是 public._gt_cpu_profiles,创建时默认 TTL 为 30 天。监控器会根据 CPU 使用量、CPU 限制和进程启动时间指标判断何时采集新的 Profile。
CPU Profile 页面与 Memory Profile 页面使用相同的交互方式。你可以通过 Pod、App、Role 和时间范围筛选 Profile 记录;使用 Capture 按需采集 CPU Profile;并通过行内操作打开火焰图或下载原始 pprof 文件用于离线分析。
手动采集会忽略阈值状态,但仍要求对应 Pod 能够从 CPU 指标中被发现。