使用 OpenTelemetry Collector 和 GreptimeDB 采集 Kubernetes 事件
本指南介绍如何使用 OpenTelemetry Collector 采集 Kubernetes 事件, 通过 GreptimeDB Pipeline 将事件转换为结构化的表, 并使用 SQL 查询这些事件。
Kubernetes 事件
Kubernetes 事件记录集群对象的状态变化和错误,
例如 Pod 调度、镜像拉取、容器重启、探针失败和扩缩容操作。
kubectl get events 和 kubectl describe 可以查看这些事件。
kube-apiserver 默认只保留一小时内的事件,保留时长由 --event-ttl 参数控制。
事件写入 GreptimeDB 后,保留时长由表的 TTL 决定,并且可以用 SQL 查询。
架构概览
组件:
- OpenTelemetry Collector:通过
k8s_objectsreceiver watchevents.k8s.io/v1API,将每个事件作为一条 OTLP 日志发送给 GreptimeDB。 - GreptimeDB Pipeline:解析日志 body 中的事件对象,提取查询需要的字段。
- GreptimeDB:将事件存储在表中,并为过滤和全文搜索建立索引。
Vector 没有采集 Kubernetes 事件的 source,
它的 kubernetes_logs source 只采集容器日志。
前提条件
- 一个运行中的 Kubernetes 集群
- 已配置
kubectl以访问你的集群 - 已安装 Helm v3.0.0 或更高版本
- 在 Kubernetes 集群中运行的 GreptimeDB 集群, 部署方法请参考部署 GreptimeDB 集群。
本指南假设 GreptimeDB 集群名为 greptimedb,部署在 greptime-cluster 命名空间,
与使用 Prometheus 和 GreptimeDB 监控 Kubernetes 指标一致。
Kubernetes 集群内的 frontend 服务地址为:
greptimedb-frontend.greptime-cluster.svc.cluster.local:4000
如果使用了不同的名称或命名空间,请替换本指南所有配置中的这一地址。
本文示例在 Kubernetes v1.30.0 和 OpenTelemetry Collector Helm chart 0.178.3(Collector v0.163.2)上测试通过。
创建 Pipeline
k8s_objects receiver 会把完整的 watch 通知放进日志 body,
包括 watch 类型(ADDED 或 MODIFIED)和完整的 Event 对象,其中也包括 managedFields。
不使用 Pipeline 时,GreptimeDB 会把整条通知作为一个 JSON 字符串存入 body 列。
k8s_events_pipeline 会把查询需要的字段提取到单独的列中。
将 GreptimeDB frontend 的 HTTP 端口(4000)和 MySQL 端口(4002)转发到本地:
kubectl port-forward -n greptime-cluster svc/greptimedb-frontend 4000:4000 4002:4002
创建 k8s_events_pipeline.yaml 文件:
version: 2
processors:
  - vrl:
      source: |
        event = parse_json!(.Body)
        obj = object!(event.object)
        count = obj.series.count
        if is_null(count) { count = obj.deprecatedCount }
        if is_null(count) { count = 1 }
        . = {
          "timestamp": .ObservedTimestamp,
          "k8s_namespace": obj.metadata.namespace,
          "object_kind": obj.regarding.kind,
          "object_name": obj.regarding.name,
          "event_type": obj.type,
          "reason": obj.reason,
          "note": obj.note,
          "reporting_controller": obj.reportingController,
          "reporting_instance": obj.reportingInstance,
          "count": count,
          "event_uid": obj.metadata.uid
        }
        .

transform:
  - field: timestamp
    type: epoch, ns
    index: timestamp
  - fields:
      - k8s_namespace
      - object_kind
      - event_type
    type: string
    tag: true
  - field: object_name
    type: string
    index: skipping
  - field: reason
    type: string
    index: inverted
  - field: note
    type: string
    index: fulltext
  - fields:
      - reporting_controller
      - reporting_instance
      - event_uid
    type: string
  - field: count
    type: int64
该 Pipeline 的处理逻辑如下:
Body和ObservedTimestamp是 OTLP 日志 Pipeline 输入中的字段,Body是 JSON 字符串形式的 watch 通知。vrl处理器解析 body,并用选出的字段替换整个 Pipeline 上下文,因此managedFields等不需要的字段不会被存储。timestamp是 Collector 收到通知的时间。事件重复发生时,Kubernetes 会更新已有的 Event 对象,更新以MODIFIED通知的形式到达。事件记录器会对这些更新做批量写回、聚合或限流,因此一条通知可能对应多次发生,部分发生也可能没有对应的通知。count是发送通知时 Event 对象中记录的发生次数。通过events.k8s.io/v1API 写入的事件把次数记录在series.count中,通过核心v1API 写入的事件(例如 kubelet 产生的事件)记录在deprecatedCount中。两个字段都没有时,count为1。由于上述批量写回,该值可能落后于实际发生次数。k8s_namespace、object_kind和event_type是 tag,它们的基数较低。object_name使用跳数索引,reason使用倒排索引,note使用全文索引。
上传 Pipeline:
curl -X POST "http://localhost:4000/v1/pipelines/k8s_events_pipeline" \
  -F "file=@k8s_events_pipeline.yaml"
{"pipelines":[{"name":"k8s_events_pipeline","version":"2026-11-17 12:37:57.195976821"}],"execution_time_ms":1}
有关 Pipeline 的更多信息,请参考管理 Pipeline。
安装 OpenTelemetry Collector
添加 OpenTelemetry Helm 仓库
helm repo add open-telemetry https://open-telemetry.github.io/opentelemetry-helm-charts
helm repo update
配置 Collector
创建 otel-collector-values.yaml 文件:
mode: deployment
# 每个副本都会 watch 全部事件,多个副本会写入重复的数据。
replicaCount: 1

image:
  repository: otel/opentelemetry-collector-contrib

clusterRole:
  create: true
  rules:
    - apiGroups: ["events.k8s.io"]
      resources: ["events"]
      verbs: ["list", "watch"]

config:
  receivers:
    k8s_objects:
      objects:
        - name: events
          group: events.k8s.io
          mode: watch
          exclude_watch_type: [DELETED]
  exporters:
    otlp_http/greptimedb:
      endpoint: http://greptimedb-frontend.greptime-cluster.svc.cluster.local:4000/v1/otlp
      headers:
        x-greptime-log-table-name: k8s_events
        x-greptime-pipeline-name: k8s_events_pipeline
  service:
    pipelines:
      logs:
        receivers: [k8s_objects]
        exporters: [otlp_http/greptimedb]
      metrics: null
      traces: null
该配置的作用如下:
mode: deployment和replicaCount: 1让整个集群只运行一个 Collector。clusterRole授予 Collector 在所有命名空间中 list 和 watch 事件的权限。k8s_objectsreceiver watchevents.k8s.io/v1事件。exclude_watch_type: [DELETED]丢弃 kube-apiserver 删除过期事件时产生的通知。otlp_http/greptimedbexporter 将日志发送到 GreptimeDB 的 OTLP 端点。x-greptime-log-table-nameheader 指定表名,x-greptime-pipeline-nameheader 指定k8s_events_pipeline。metrics: null和traces: null移除 chart 默认配置中的 metrics 和 traces pipeline。
Collector 启动时不会回放已有的事件。 安装 Collector 之前或 Collector 停止期间产生的事件不会被采集。
如果 GreptimeDB 启用了鉴权,
请参考 OTel Collector 为 exporter 添加 basicauth 扩展。
安装 Collector
helm install otel-collector open-telemetry/opentelemetry-collector \
  --namespace monitoring \
  --create-namespace \
  --values otel-collector-values.yaml
检查 Collector 是否正常运行:
kubectl get pods -n monitoring -l app.kubernetes.io/name=opentelemetry-collector
NAME                                                      READY   STATUS    RESTARTS   AGE
otel-collector-opentelemetry-collector-56d8864b4b-gm9gl   1/1     Running   0          2s
在 GreptimeDB 中验证事件
创建一个引用不存在镜像的 Deployment,
Kubernetes 在拉取镜像失败时会产生 Warning 事件:
kubectl create deployment bad-image --image=nginx:does-not-exist
通过创建 Pipeline 中的端口转发,使用 MySQL 客户端连接 GreptimeDB:
mysql -h 127.0.0.1 -P 4002
第一个事件到达时,GreptimeDB 会创建 k8s_events 表:
SHOW CREATE TABLE k8s_events;
CREATE TABLE IF NOT EXISTS `k8s_events` (
  `timestamp` TIMESTAMP(9) NOT NULL,
  `k8s_namespace` STRING NULL,
  `object_kind` STRING NULL,
  `event_type` STRING NULL,
  `object_name` STRING NULL SKIPPING INDEX WITH(false_positive_rate = '0.01', granularity = '10240', type = 'BLOOM'),
  `reason` STRING NULL INVERTED INDEX,
  `note` STRING NULL FULLTEXT INDEX WITH(analyzer = 'English', backend = 'bloom', case_sensitive = 'false', false_positive_rate = '0.01', granularity = '10240'),
  `reporting_controller` STRING NULL,
  `reporting_instance` STRING NULL,
  `event_uid` STRING NULL,
  `count` BIGINT NULL,
  TIME INDEX (`timestamp`),
  PRIMARY KEY (`k8s_namespace`, `object_kind`, `event_type`)
)

ENGINE=mito
WITH(
  'comment' = 'Created on insertion',
  append_mode = 'true',
  'greptime.semantic.signal_type' = 'log',
  'greptime.semantic.source' = 'opentelemetry'
)
该表以追加模式(append mode)创建,每条通知都会作为单独的一行保存。
查询事件
查询最近的 Warning 事件:
SELECT timestamp, k8s_namespace, object_kind, object_name, reason, note
FROM k8s_events
WHERE event_type = 'Warning'
ORDER BY timestamp DESC
LIMIT 5;
+----------------------------+---------------+-------------+---------------------------+--------+-------------------------------------------------------------+
| timestamp                  | k8s_namespace | object_kind | object_name               | reason | note                                                        |
+----------------------------+---------------+-------------+---------------------------+--------+-------------------------------------------------------------+
| 2026-11-17 12:38:56.564240 | default       | Pod         | bad-image-66c6f97bd-mtm6v | Failed | Error: ImagePullBackOff                                     |
| 2026-11-17 12:38:42.134856 | default       | Pod         | bad-image-66c6f97bd-mtm6v | Failed | Error: ErrImagePull                                         |
| 2026-11-17 12:38:42.132237 | default       | Pod         | bad-image-66c6f97bd-mtm6v | Failed | Failed to pull image "nginx:does-not-exist": rpc error: ... |
| 2026-11-17 12:38:28.576529 | default       | Pod         | bad-image-66c6f97bd-mtm6v | Failed | Error: ImagePullBackOff                                     |
| 2026-11-17 12:38:16.063063 | default       | Pod         | bad-image-66c6f97bd-mtm6v | Failed | Error: ErrImagePull                                         |
+----------------------------+---------------+-------------+---------------------------+--------+-------------------------------------------------------------+
统计最近一小时内各原因的 Warning 通知数量。
每一行对应收到的一条通知,而不是事件的一次发生:
SELECT reason, object_kind, count(*) AS notifications
FROM k8s_events
WHERE event_type = 'Warning'
  AND timestamp > now() - INTERVAL '1' HOUR
GROUP BY reason, object_kind
ORDER BY notifications DESC;
+--------+-------------+---------------+
| reason | object_kind | notifications |
+--------+-------------+---------------+
| Failed | Pod         |             9 |
+--------+-------------+---------------+
按分钟统计各命名空间的 Warning 通知数量:
SELECT date_bin(INTERVAL '1' MINUTE, timestamp) AS minute, k8s_namespace, count(*) AS notifications
FROM k8s_events
WHERE event_type = 'Warning'
GROUP BY minute, k8s_namespace
ORDER BY minute;
+---------------------+---------------+---------------+
| minute              | k8s_namespace | notifications |
+---------------------+---------------+---------------+
| 2026-11-17 12:38:00 | default       |             9 |
+---------------------+---------------+---------------+
使用全文搜索检索事件消息:
SELECT timestamp, object_name, note
FROM k8s_events
WHERE note @@ 'Back-off'
ORDER BY timestamp DESC
LIMIT 3;
+----------------------------+---------------------------+-----------------------------------------------+
| timestamp                  | object_name               | note                                          |
+----------------------------+---------------------------+-----------------------------------------------+
| 2026-11-17 12:38:56.561306 | bad-image-66c6f97bd-mtm6v | Back-off pulling image "nginx:does-not-exist" |
| 2026-11-17 12:38:28.569168 | bad-image-66c6f97bd-mtm6v | Back-off pulling image "nginx:does-not-exist" |
| 2026-11-17 12:38:01.133685 | bad-image-66c6f97bd-mtm6v | Back-off pulling image "nginx:does-not-exist" |
+----------------------------+---------------------------+-----------------------------------------------+
查看某个 Pod 的事件历史,将 Pod 名称替换为集群中实际的 Pod:
SELECT timestamp, reason, count, note
FROM k8s_events
WHERE object_name = 'bad-image-66c6f97bd-mtm6v'
ORDER BY timestamp;
+----------------------------+-----------+-------+----------------------------------------------------------------------------------+
| timestamp                  | reason    | count | note                                                                             |
+----------------------------+-----------+-------+----------------------------------------------------------------------------------+
| 2026-11-17 12:37:59.239772 | Scheduled |     1 | Successfully assigned default/bad-image-66c6f97bd-mtm6v to k8s-tut-control-plane |
| 2026-11-17 12:37:59.618471 | Pulling   |     1 | Pulling image "nginx:does-not-exist"                                             |
| 2026-11-17 12:38:00.177770 | Failed    |     1 | Failed to pull image "nginx:does-not-exist": rpc error: ...                      |
| 2026-11-17 12:38:00.179947 | Failed    |     1 | Error: ErrImagePull                                                              |
| 2026-11-17 12:38:01.133685 | BackOff   |     1 | Back-off pulling image "nginx:does-not-exist"                                    |
| 2026-11-17 12:38:01.136782 | Failed    |     1 | Error: ImagePullBackOff                                                          |
| 2026-11-17 12:38:15.561016 | Pulling   |     2 | Pulling image "nginx:does-not-exist"                                             |
| 2026-11-17 12:38:16.059460 | Failed    |     2 | Failed to pull image "nginx:does-not-exist": rpc error: ...                      |
| 2026-11-17 12:38:16.063063 | Failed    |     2 | Error: ErrImagePull                                                              |
| 2026-11-17 12:38:28.569168 | BackOff   |     2 | Back-off pulling image "nginx:does-not-exist"                                    |
| ......                                                                                                                         |
+----------------------------+-----------+-------+----------------------------------------------------------------------------------+
在 GreptimeDB Dashboard 中查看事件
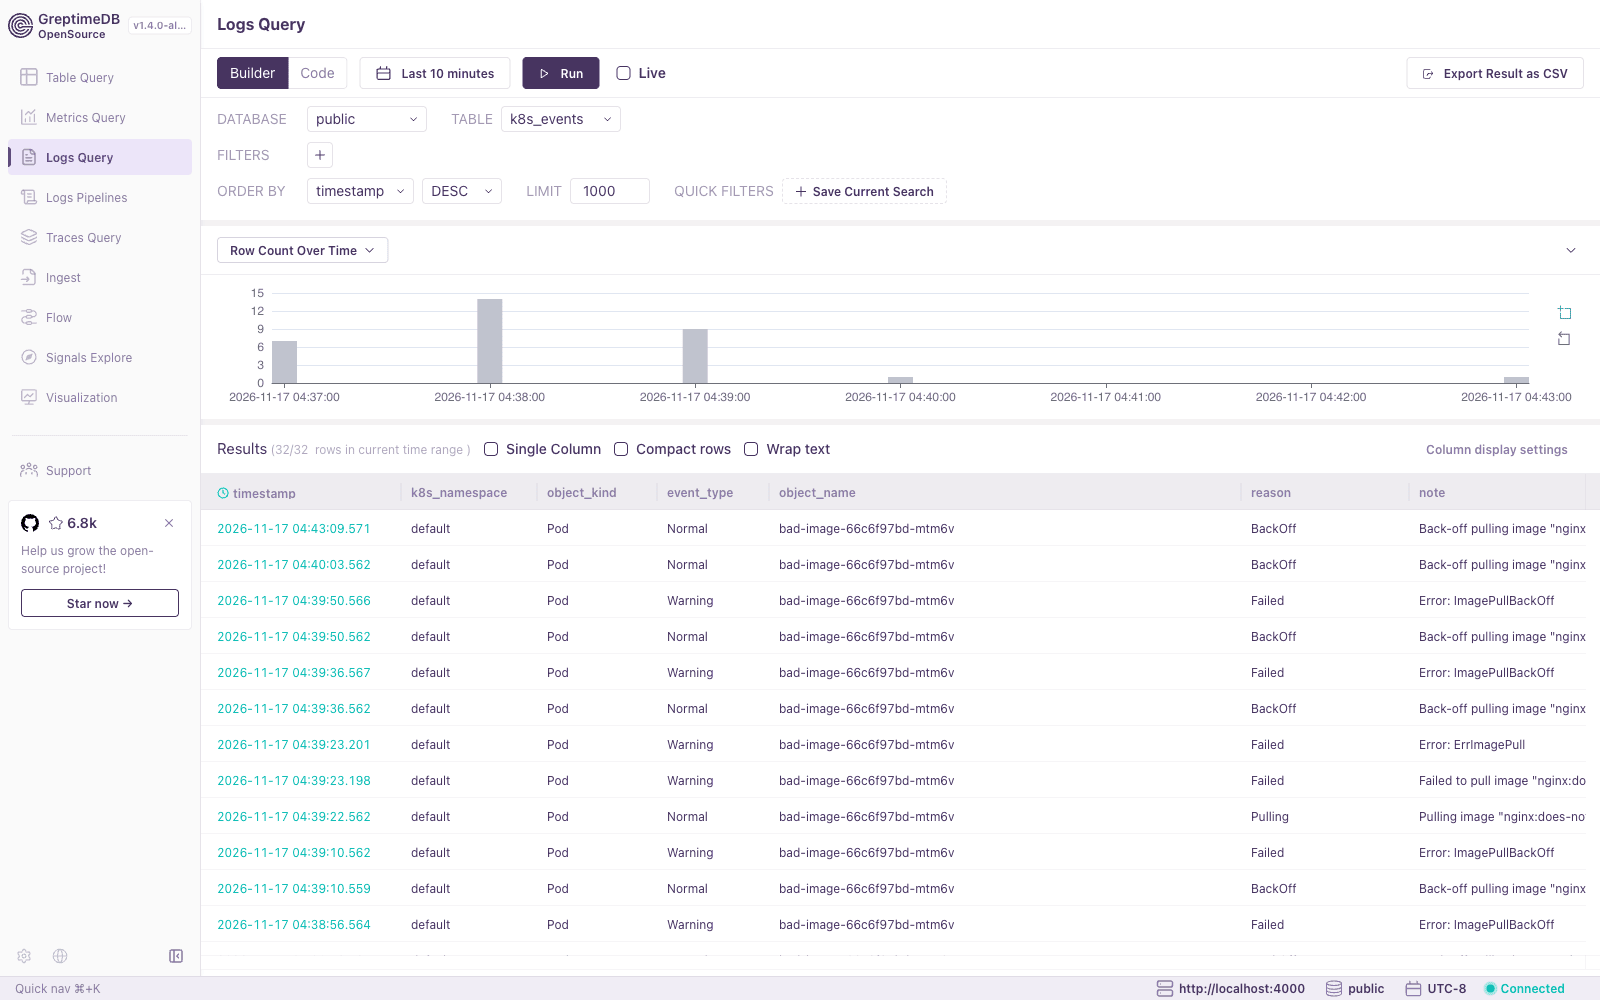
GreptimeDB 自带的 Web Dashboard 提供 Logs Query 视图。
保持创建 Pipeline 中的端口转发运行,打开 http://localhost:4000/dashboard,
在侧边栏选择 Logs Query,然后选择 k8s_events 表。
该视图会显示所选时间范围内的行数随时间的变化,以及具体的事件记录。
在 Grafana 中查看事件
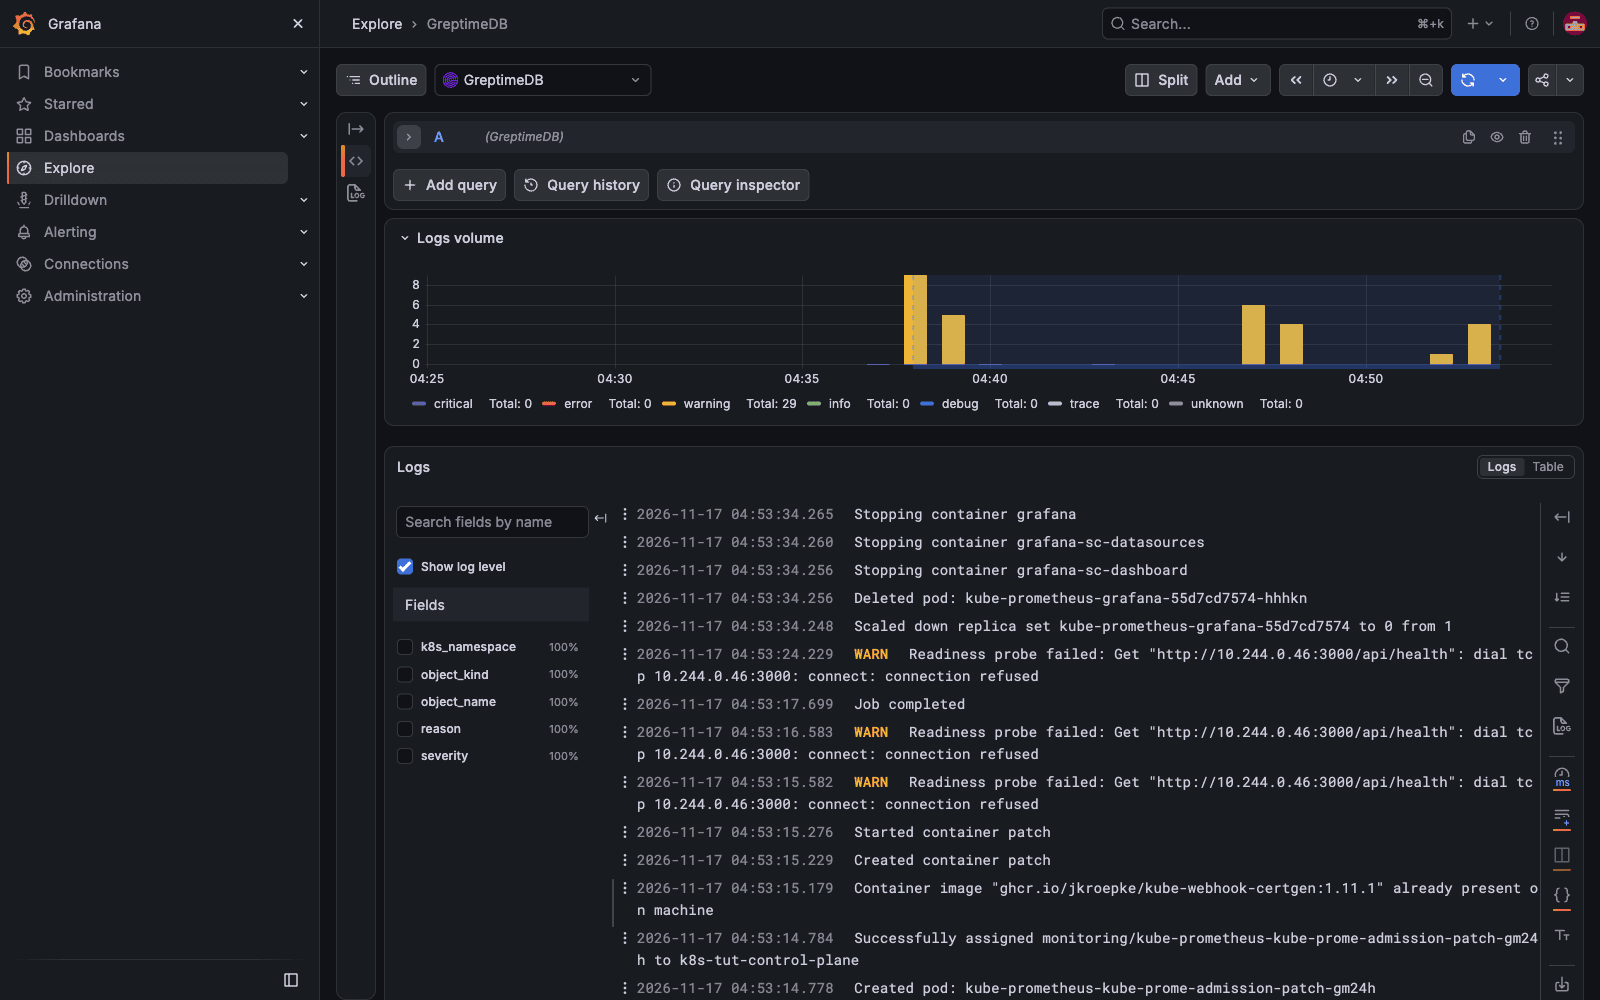
Grafana 的 GreptimeDB 数据源插件提供 Logs 查询类型, 可以在 Grafana 的日志视图中展示查询结果。
本节使用使用 Prometheus 和 GreptimeDB 监控 Kubernetes 指标中由 kube-prometheus-stack 安装的 Grafana。
修改 kube-prometheus-values.yaml,安装插件并添加 GreptimeDB 数据源:
prometheus:
  prometheusSpec:
    remoteWrite:
      - url: http://greptimedb-frontend.greptime-cluster.svc.cluster.local:4000/v1/prometheus/write

grafana:
  sidecar:
    datasources:
      url: http://greptimedb-frontend.greptime-cluster.svc.cluster.local:4000/v1/prometheus
  # 安装 GreptimeDB 数据源插件,格式为 <插件 ID>@<版本>@<URL>
  plugins:
    - info8fcc-greptimedb-datasource@3.0.4@https://github.com/GreptimeTeam/greptimedb-grafana-datasource/releases/download/v3.0.4/info8fcc-greptimedb-datasource-unsigned.zip
  grafana.ini:
    plugins:
      allow_loading_unsigned_plugins: info8fcc-greptimedb-datasource
  additionalDataSources:
    - name: GreptimeDB
      type: info8fcc-greptimedb-datasource
      url: http://greptimedb-frontend.greptime-cluster.svc.cluster.local:4000
      jsonData:
        host: http://greptimedb-frontend.greptime-cluster.svc.cluster.local:4000
        database: public
        logs:
          defaultDatabase: public
          defaultTable: k8s_events
          timeColumn: timestamp
          messageColumn: note
          levelColumn: event_type
          selectContextColumns: true
          contextColumns:
            - k8s_namespace
            - object_kind
            - object_name
            - reason
logs 配置把 k8s_events 表的列映射到日志视图:
note 作为日志消息,event_type 作为日志级别,因此 Warning 事件会显示为 warning 级别。
contextColumns 中的列会加入每次日志查询,并显示为每条日志的字段。
该配置在 kube-prometheus-stack 93.3.1(安装的 Grafana 版本为 13.3.1)上测试通过。
升级 release:
helm upgrade kube-prometheus prometheus-community/kube-prometheus-stack \
  --namespace monitoring \
  --values kube-prometheus-values.yaml
登录 Grafana 后查询事件:
- 打开 Explore,选择 GreptimeDB 数据源。
- 将 Query Type 设为 Logs。查询构建器会根据数据源配置自动填入
k8s_events表,以及时间、消息和级别列。 - 在 Columns 中删除
trace_id。插件默认会在日志查询中加入trace_id列,而k8s_events表没有这一列。 - 点击 Run query。
清理
删除测试用的 Deployment:
kubectl delete deployment bad-image
设置数据保留时间
该表默认永久保留数据。 设置 TTL 可以自动删除过期的事件:
ALTER TABLE k8s_events SET 'ttl' = '30d';
下一步
- 使用 GreptimeDB 数据源插件构建 Grafana 仪表盘。
- 参考使用 Prometheus 和 GreptimeDB 监控 Kubernetes 指标采集同一集群的指标。
- 了解 Pipeline 配置和 OpenTelemetry Collector 集成的更多信息。