Prometheus
GreptimeDB 可以作为 Prometheus 的长期存储解决方案,提供无缝集成体验。
配置 Remote Write
Prometheus 配置文件
要将 GreptimeDB 集成到 Prometheus 中,
请按照以下步骤更新你的 Prometheus 配置文件(prometheus.yml):
remote_write:
- url: http://localhost:4000/v1/prometheus/write?db=public
# 如果启用了身份验证,请取消注释并设置鉴权信息
#  basic_auth:
#    username: greptime_user
#    password: greptime_pwd

remote_read:
- url: http://localhost:4000/v1/prometheus/read?db=public
# 如果启用了身份验证,请取消注释并设置鉴权信息
#  basic_auth:
#    username: greptime_user
#    password: greptime_pwd
- URL 中的 host 和 port 表示 GreptimeDB 服务器。在此示例中,服务器运行在
localhost:4000上。你可以将其替换为你自己的服务器地址。有关 GreptimeDB 中 HTTP 协议的配置,请参阅 协议选项。 - URL 中的
db参数表示要写入的数据库。它是可选的。默认情况下,数据库设置为public。 basic_auth是身份鉴权配置。如果 GreptimeDB 启用了鉴权,请填写用户名和密码。请参阅 鉴权认证文档。
Grafana Alloy 配置文件
如果你使用 Grafana Alloy,请在 Alloy 配置文件(config.alloy)中配置 Remote Write。有关更多信息,请参阅 Alloy 文档。
Vector 配置文件
如果你使用 Vector ,请在 Vector 配置文件(vector.toml)中配置 Remote Write。有关更多信息,请参阅 Vector 文档.
数据模型
在 GreptimeDB 的数据模型中,数据被组织成具有 tag、time index 和 field 的表。 GreptimeDB 可以被视为多值数据模型,自动将多个 Prometheus 指标分组到相应的表中。 这样可以实现高效的数据管理和查询。
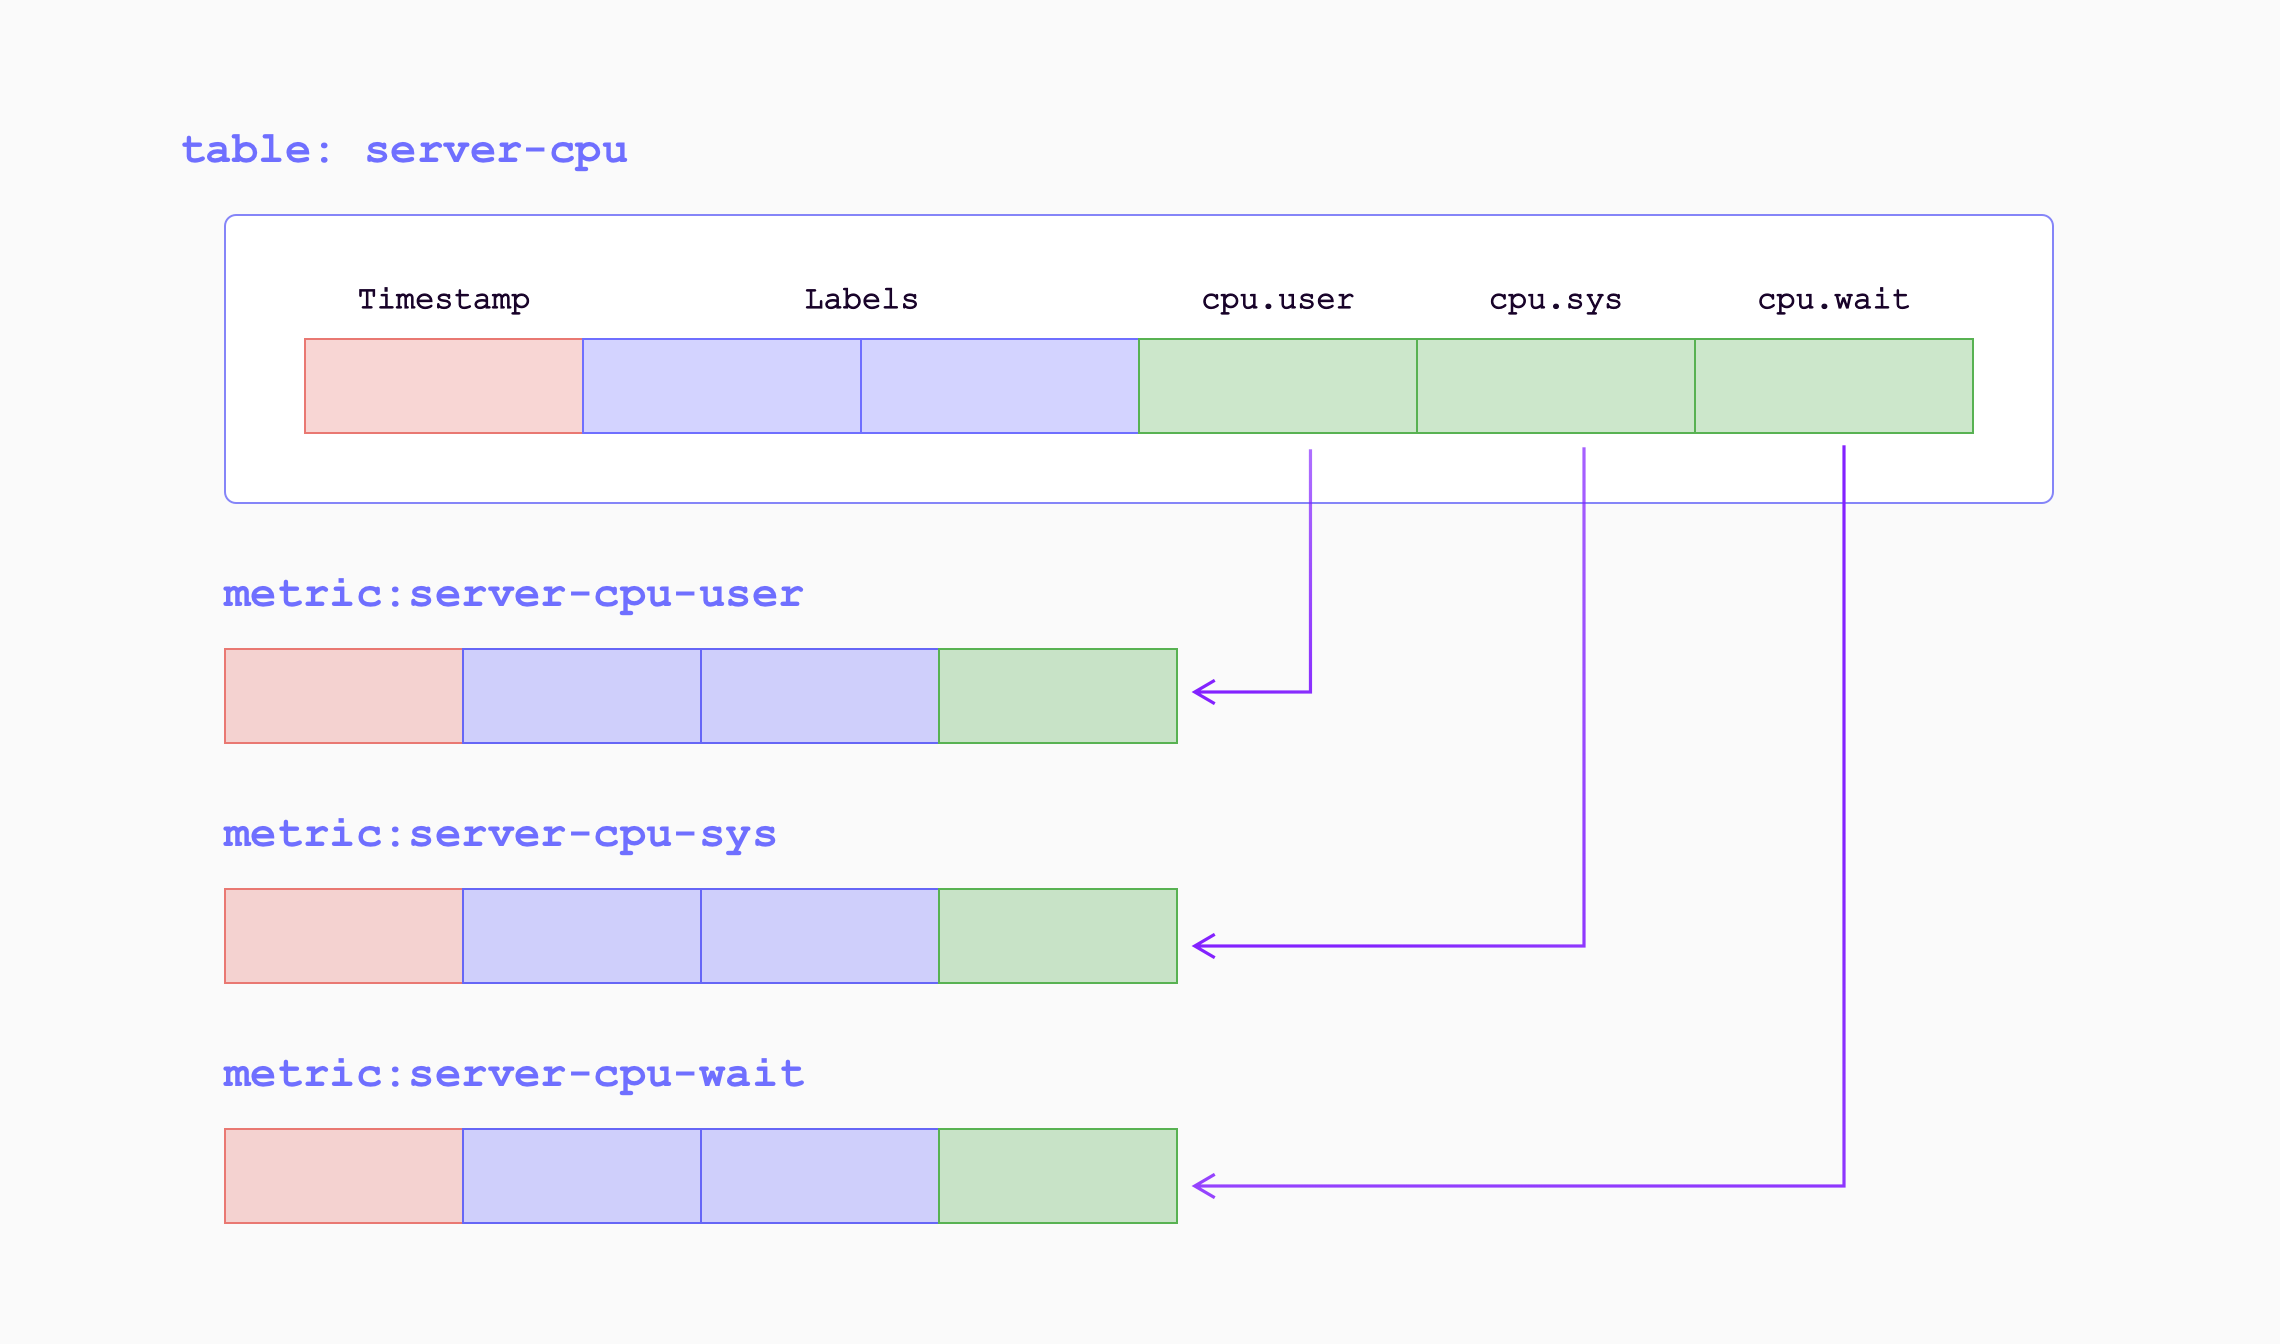
当指标通过远程写入端点写入 GreptimeDB 时,它们将被转换为以下形式:
| Sample Metrics | In GreptimeDB | GreptimeDB Data Types |
|---|---|---|
| Name | Table (Auto-created) Name | String |
| Value | Column (Field) | Double |
| Timestamp | Column (Time Index) | Timestamp |
| Label | Column (Tag) | String |
例如,以下 Prometheus 指标:
prometheus_remote_storage_samples_total{instance="localhost:9090", job="prometheus",
remote_name="648f0c", url="http://localhost:4000/v1/prometheus/write"} 500
将被转换为表 prometheus_remote_storage_samples_total 中的一行:
| Column | Value | Column Data Type |
|---|---|---|
| instance | localhost:9090 | String |
| job | prometheus | String |
| remote_name | 648f0c | String |
| url | http://localhost:4000/v1/prometheus/write | String |
| greptime_value | 500 | Double |
| greptime_timestamp | The sample's unix timestamp | Timestamp |
通过使用 metric engine 提高效率
Prometheus Remote Write 写入数据的方式经常会创建大量的小表,这些表在 GreptimeDB 中被归类为逻辑表。 然而,拥有大量的小表对于数据存储和查询性能来说是低效的。 为了解决这个问题,GreptimeDB 引入了 metric engine 功能,将逻辑表表示的数据存储在单个物理表中。 这种方法减少了存储开销并提高了列式压缩效率。
GreptimeDB 默认启用 metric engine,你不需要指定任何额外的配置。
默认情况下,使用的物理表为 greptime_physical_table。
如果你想使用特定的物理表,可以在 Remote Write URL 中指定 physical_table 参数。
如果指定的物理表不存在,它将被自动创建。
remote_write:
- url: http://localhost:4000/v1/prometheus/write?db=public&physical_table=greptime_physical_table
虽然数据被存储在物理表中,但查询可以在逻辑表上执行以提供从指标角度的直观视角。 例如,当成功写入数据时,你可以使用以下命令显示逻辑表:
show tables;
+---------------------------------------------------------------+
| Tables                                                        |
+---------------------------------------------------------------+
| prometheus_remote_storage_enqueue_retries_total               |
| prometheus_remote_storage_exemplars_pending                   |
| prometheus_remote_storage_read_request_duration_seconds_count |
| prometheus_rule_group_duration_seconds                        |
| ......                                                        |
+---------------------------------------------------------------+
物理表本身也可以进行查询。 它包含了所有逻辑表的列,方便进行多表连接分析和计算。
要查看物理表的 schema,请使用 DESC TABLE 命令:
DESC TABLE greptime_physical_table;
物理表包含了所有逻辑表的列:
+--------------------+----------------------+------+------+---------+---------------+
| Column             | Type                 | Key  | Null | Default | Semantic Type |
+--------------------+----------------------+------+------+---------+---------------+
| greptime_timestamp | TimestampMillisecond | PRI  | NO   |         | TIMESTAMP     |
| greptime_value     | Float64              |      | YES  |         | FIELD         |
| __table_id         | UInt32               | PRI  | NO   |         | TAG           |
| __tsid             | UInt64               | PRI  | NO   |         | TAG           |
| device             | String               | PRI  | YES  |         | TAG           |
| instance           | String               | PRI  | YES  |         | TAG           |
| job                | String               | PRI  | YES  |         | TAG           |
| error              | String               | PRI  | YES  |         | TAG           |
...
你可以使用 SELECT 语句根据需要从物理表中过滤数据。
例如,根据逻辑表 A 的 device 条件和逻辑表 B 的 job 条件来过滤数据:
SELECT *
FROM greptime_physical_table
WHERE greptime_timestamp > "2024-08-07 03:27:26.964000"
  AND device = "device1"
  AND job = "job1";
在 GreptimeDB 集群上使用 metric engine
在使用 Prometheus remote write 写入 GreptimeDB 集群时,用户可能注意到集群中只有 一 个 datanode 承载写入压力,其他节点没有流量。这是由于在默认配置下,集群中只有 一个 metric engine 物理表,且该表只有一个分区。承载此分区的节点将承担所有写入流 量。
为什么我们没有创建更多的分区呢?GreptimeDB 的表分 区基于预 定义的分区列。然而在 Prometheus 生态中并没有普遍存在的列(Prometheus 中的标签) 适合作为默认分区列。
因此,我们推荐用户基于自己的数据模型创建分区规则。例如,在监控 Kubernetes 集群的
场景下,namespace 可能是一个比较好的分区键。这个分区键应当具备一定的基数用于区
分数据。并且我们推荐用户在初始时创建 datanode 数量大约 2 倍至 3 倍的分区数量,为日后
集群扩容负载均衡做准备。
以下是一个分区的物理表例子:
CREATE TABLE greptime_physical_table (
    greptime_timestamp TIMESTAMP(3) NOT NULL,
    greptime_value DOUBLE NULL,
    namespace STRING PRIMARY KEY,
    TIME INDEX (greptime_timestamp),
)
PARTITION ON COLUMNS (namespace) (
  namespace <'g',
  namespace >= 'g' AND namespace < 'n',
  namespace >= 'n' AND namespace < 't',
  namespace >= 't'
)
ENGINE = metric
with (
    "physical_metric_table" = "",
);
注意这里用户并不需要手动指定所有可能的主键(标签),metric engine 将会自动添加。 只有涉及到分区规则的列需要进行提前指定。
特殊标签
此实验性功能可能存在预期外的行为,其功能未来可能发生变化。
一般来说,一次 Remote write 请求的全部数据会以同样的配置项被写入到数据库中,例如,开启 metric engine 后使用的同一个物理表配置。 即使指标的数量在增长,所有的逻辑表(即指标们)都会保存到同一张物理表中。 对于写入这可能是没问题的。但是对于需要查询一小部分指标的场景,这种设置可能会拖慢查询速度,因为所有的指标都聚集在一张物理表上,而数据库需要对全表的数据进行扫描。
如果你可以预见大量的数据写入和每次只需查询小部分指标的场景,那么可以在写入时对存储位置进行划分以减缓后续查询的压力。 对于一个 Remote write 请求中的每个指标,这种精细的控制可以通过写入时的配置项来达成。
从 v0.15 开始,GreptimeDB 新增了对特殊标签的支持。
这些标签(与它们的值)会在解析阶段被转换成写入时的配置项,使请求内的单个指标可以被更精细地控制。
这些标签不是互斥的,它们可以通过组合的方式达成更多样化的控制选择。
以下是指标特殊标签的一个示例,注意这不是实际的数据模型。
__name__ | x_greptime_database | x_greptime_physical_table | pod_name_label | __normal_label_with_underscore_prefix__ | timestamp | value |
|---|---|---|---|---|---|---|
some_metric_name | public | p_1 | random_k8s_pod_name | true | 2025-06-17 16:31:52.000 | 12.1 |
上述特殊标签只是在 Prometheus 中的普通有效标签。 GreptimeDB 可以识别一些标签的名称,并将它们转换成写入时的配置项。 就像自定义的 HTTP header 一样,你可以通过设定一些有效的 HTTP header 键值对来指示后续的操作,只是这些 header 键值对在特定的程序之外不起任何作用。
以下是所有 GreptimeDB 支持的标签名称:
x_greptime_databasex_greptime_physical_table
设置标签
如何将标签设置到指标上,与你所使用的收集指标并发送到数据库的工具(或者代码)相关。
如果你使用 Prometheus 从源获取指标并使用 Remote write 将他们发送到 GreptimeDB 中,可以在全局设定中增加 external_labels 的配置。
参考这个文档。
对于其他的收集工具也是一样的。对于你所使用的工具,你可能需要查找相应的设置。
x_greptime_database
这个选项决定指标数据会被保存到哪个数据库中,该数据库需要被提前创建好(例如通过 create database xxx SQL 语句)。
一般来说,同样的技术栈会产生同样名称的指标。 例如你有两个 Kubernetes 集群,但是运行了不同的应用,然后通过一个指标收集工具同时收集两个集群的指标。 这两个集群会产生名称一样但是标签和值完全不同的指标。 如果这些指标被写入到同一个数据库中,那么在使用 Grafana 大盘浏览这些指标的时候,就需要对大盘的每个图表手动设置标签值,才能区分集群进行查看。 这样既繁琐又低效。
在这种情况下,你可以在写入时将指标保存到两个不同的数据库中,然后使用两个大盘分别浏览这些指标。
x_greptime_physical_table
如果指标通过 metric engine 进行存储,那么每个指标的逻辑表背后是一张物理表。 默认下,所有的指标都使用同一张物理表。 随着指标数量的增长,这张物理表会变成一张超级宽表。如果指标的写入频率不同,那么物理表的数据将会是稀疏的。 在全量指标数据集中查找一个特定的指标或者标签将会消耗大量时间,因为数据库需要扫描所有不相关的数据。
这种场景下,将指标写入到不同的物理表可以减轻单一物理表的压力,这对通过写入频率来聚合指标的场景非常有用。
注意,指标的逻辑表在创建时就与物理表一一关联。在同一数据库下为同一指标设定不同的物理表不会生效。
在 Remote write 中使用 pipeline
此实验性功能可能存在预期外的行为,其功能未来可能发生变化。
从 v0.15 开始,GreptimeDB 支持在 Prometheus Remote Write 协议入口使用 pipeline 处理数据。
你可以通过在 HTTP header 中将 x-greptime-pipeline-name 的值设置为需要执行的 pipeline 名称来使用 pipeline 处理流程。
以下是一个非常简单的 pipeline 配置例子,使用 vrl 处理器来对每个指标增加一个 source 标签:
version: 2
processors:
  - vrl:
      source: |
        .source = "local_laptop"
        .

transform:
  - field: greptime_timestamp
    type: time, ms
    index: timestamp
结果如下所示
mysql> select * from `go_memstats_mcache_inuse_bytes`;
+----------------------------+----------------+--------------------+---------------+--------------+
| greptime_timestamp         | greptime_value | instance           | job           | source       |
+----------------------------+----------------+--------------------+---------------+--------------+
| 2025-07-11 07:42:03.064000 |           1200 | node_exporter:9100 | node-exporter | local_laptop |
| 2025-07-11 07:42:18.069000 |           1200 | node_exporter:9100 | node-exporter | local_laptop |
+----------------------------+----------------+--------------------+---------------+--------------+
2 rows in set (0.01 sec)
更多配置详情请参考 pipeline 相关文档。
性能优化
默认情况下,metric engine 会自动创建一个名为 greptime_physical_table 的物理表。
为了优化性能,你可以选择创建一个具有自定义配置的物理表。
启用跳数索引
默认情况下,metric engine 不会为列创建索引。你可以通过设置 index.type 为 skipping 来设置索引类型。
创建一个带有跳数索引的物理表。所有自动添加的列都将应用跳数索引。
CREATE TABLE greptime_physical_table (
    greptime_timestamp TIMESTAMP(3) NOT NULL,
    greptime_value DOUBLE NULL,
    TIME INDEX (greptime_timestamp),
)
engine = metric
with (
    "physical_metric_table" = "",
    "index.type" = "skipping"
);
有关更多配置,请参阅 create table 部分。
VictoriaMetrics Remote Write
VictoriaMetrics 对 Prometheus 远程写入协议进行了轻微修改,以实现更好的压缩效果。
当你使用 vmagent 将数据发送到兼容的后端时,该协议会被自动启用。
GreptimeDB 也支持这个变种。只需将 GreptimeDB 的 Remote Write URL 配置为 vmagent。
例如,如果你在本地安装了 GreptimeDB:
vmagent -remoteWrite.url=http://localhost:4000/v1/prometheus/write