跳到主要内容

v1.2.0-beta.2

· 阅读需 5 分钟

Release date: August 21, 2026

GreptimeDB v1.2.0-beta.2 is the second beta of the v1.2 line. It focuses on safer table administration, better Flow and procedure observability, continued JSON2 preparation, and query and storage correctness fixes.

👍 Highlights

  • One-way skip_wal changes with ALTER TABLE — You can enable skip_wal on supported tables with ALTER TABLE, and the change is validated against the table's leader routes before the irreversible metadata update. The transition is intentionally one-way: changing skip_wal back to false is rejected (#8817, #8838).

  • JSON2 extension and layout preparation — JSON2 now has a separate extension type, type hints can be pushed down to Parquet reads, and DDL accepts JSON2 storage-layout settings. The v2 physical-layout primitives are prepared, but the v2 physical layout is not activated by this release (#8745, #8833, #8895, #8901).

  • Procedure and administration event observability — Procedure events now carry structured context, lifecycle locators, submission context, and the actor; admin function executions are recorded as events, and the shared query-channel definition keeps event protocol information consistent (#8734, #8787, #8834, #8835, #8856, #8849, #8825).

  • Safer discard-unflushed operations — The frontend heartbeat is extensible and lifecycle-safe, while storage can discard unflushed region data while preserving persisted SST files and expose the operation through an admin function (#8726, #8600, #8768).

  • Dictionary tag group-by path restored — The columnar group-by path works again for dictionary-encoded tag columns (#8902).

Dashboard

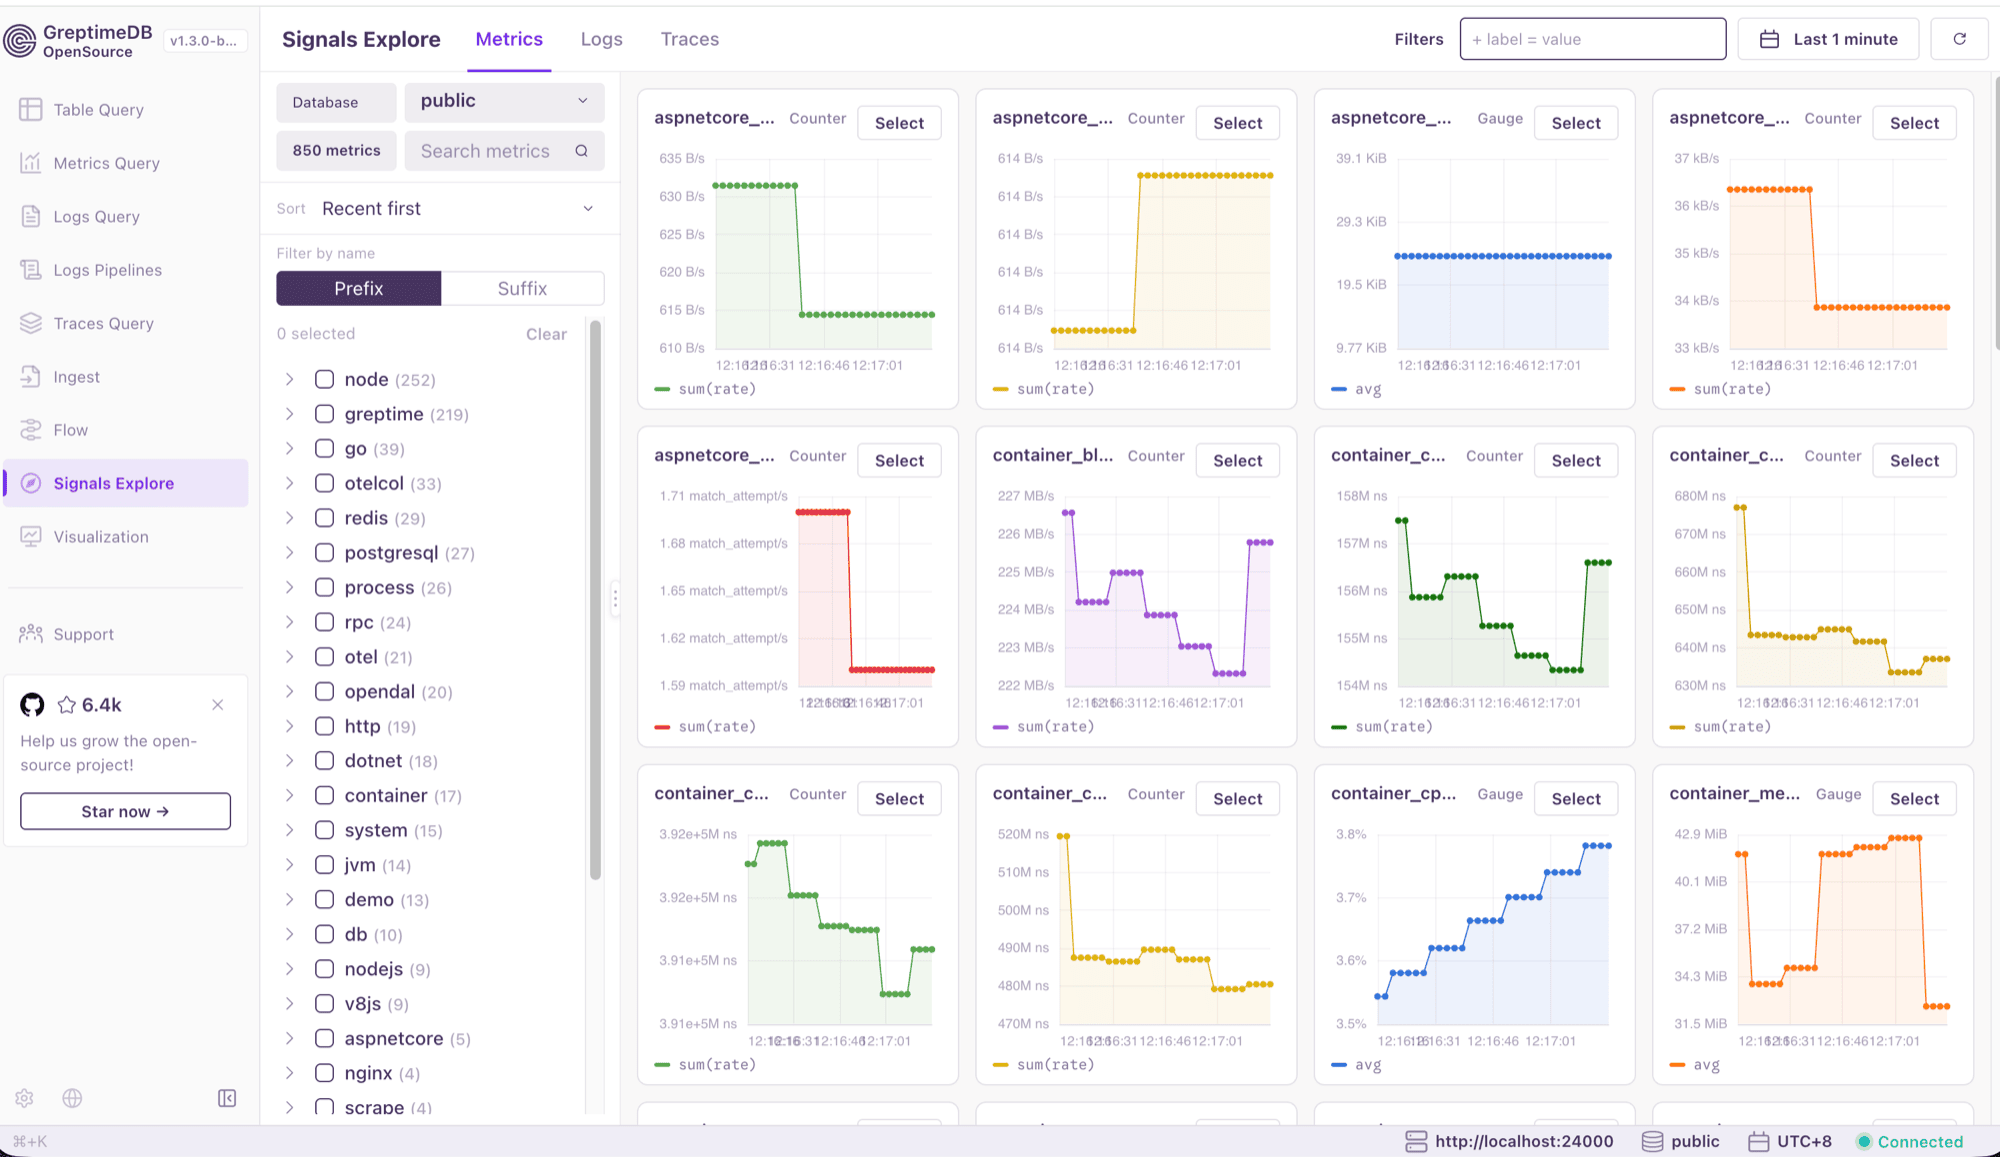
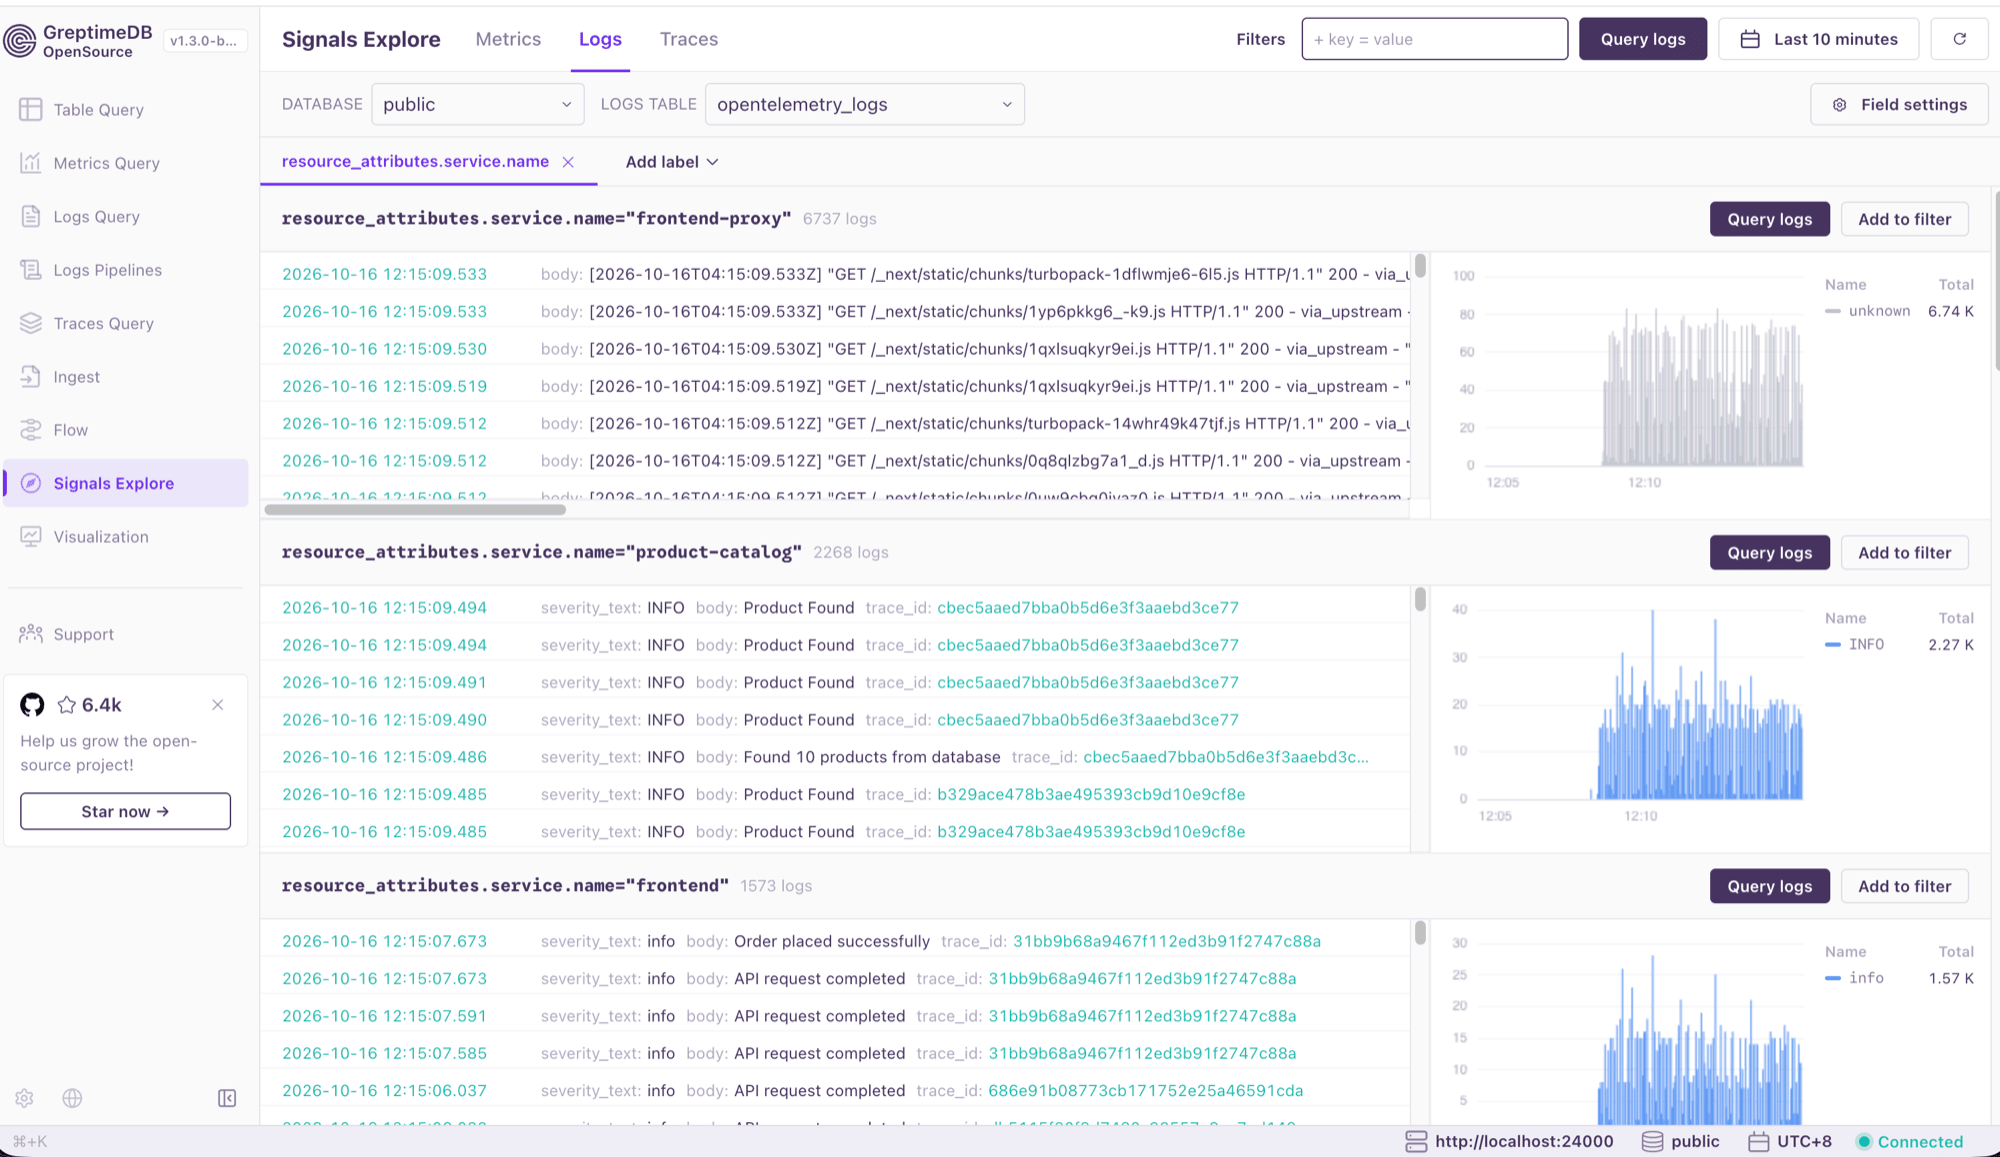
The bundled GreptimeDB dashboard was updated from v0.13.10 to v0.13.13 (#8898). The update includes:

Breaking changes

  • Soft-drop and recovery are enterprise-only again in beta2. PR #8747 gates soft-drop tables, UNDROP TABLE, ADMIN purge_table(), information_schema.recycle_bin, and expired soft-drop garbage collection behind the enterprise feature. This reverses the beta1 behavior that made these operations available in OSS. An OSS beta2 metasrv rejects gc.experimental_soft_drop.enable = true during startup, so remove that setting before upgrading. OSS beta2 also cannot recover or purge tables already soft-dropped in beta1 and does not run their expired-tombstone cleanup; recover any tables you may need before upgrading, or use Enterprise Edition to continue the soft-drop lifecycle. This is by @v0y4g3r.

  • Native histogram persisted fields change signedness. PR #8824 changes persisted native-histogram span-length list elements from UInt32 to Int32 and integer count fields from UInt64 to Int64, including renaming count_u64/zero_count_u64 to count_i64/zero_count_i64. Existing native-histogram Struct data written with the previous schema may be unreadable in beta2, and rolling binaries back does not restore or convert data written with the changed fields. There is no migration, downgrade, or mixed-version compatibility layer; do not run mixed versions, and establish a migration or reingestion plan before upgrading. This is by @sunng87.

🚀 Features

  • Add information_schema.flow_statistics and SHOW FLOW STATUS for Flow runtime observability; in distributed Flow, start_time and uptime_seconds remain unavailable (NULL) in this release (#8392) by @onepizzateam.
  • Safely discard unflushed region data while retaining persisted SST files (#8600) by @evenyag.
  • Make the frontend heartbeat extensible and lifecycle-safe (#8726) by @fengjiachun.
  • Add structured event context to procedure events (#8734) by @WenyXu.
  • Separate the JSON2 extension type from the legacy JSON extension type (#8745) by @MichaelScofield.
  • Add an admin function to discard unflushed data (#8768) by @evenyag.
  • Support enabling skip_wal with ALTER TABLE (#8817) by @evenyag.
  • Share the query-channel definition across components while preserving its wire values (#8825) by @WenyXu.
  • Push JSON2 type hints down to Parquet reads (#8833) by @fengys1996.
  • Centralize procedure event-context handling (#8834) by @WenyXu.
  • Record admin function executions as events (#8835) by @WenyXu.
  • Record the actor for procedure events (#8849) by @WenyXu.
  • Separate procedure submission context (#8856) by @WenyXu.
  • Update to pgwire 0.40.7 (#8860) by @sunng87.
  • Support JSON2 storage-layout settings in DDL (#8895) by @MichaelScofield.
  • Add JSON2 v2 physical-layout primitives; the v2 layout is not activated by this release (#8901) by @MichaelScofield.

🐛 Bug Fixes

  • Avoid unsafe count(*) wildcard rewrites (#8522) by @discord9.
  • Validate remote schemas in MergeScan (#8579) and ignore field metadata during that validation (#8818), both by @discord9.
  • Resolve custom timestamp and value columns in Prometheus remote reads (#8659) by @grezzko.
  • Limit compaction picker threads and provide a bounded compact-runtime blocking pool (#8704) by @v0y4g3r.
  • Fail open when Bloom-filter IN predicates contain non-literal or unencodable members (#8709) by @discord9.
  • Add a public compactor constructor (#8724) by @sunng87.
  • Fix Flow statistics aggregation and quoting in df_plan_to_sql (#8729) by @discord9.
  • Remove gRPC DDL panics for DropView and non-timestamp time indexes (#8739) by @discord9.
  • Release region guards after a drop rollback (#8751) by @WenyXu.
  • Handle Utf8View tag and label columns without panicking (#8772) by @discord9.
  • Cache physical-table metadata lookups (#8777) by @shuiyisong.
  • Preserve procedure lifecycle locators (#8787) by @WenyXu.
  • Re-encode bulk WAL entries after filling missing columns (#8808) by @fengjiachun.
  • Backport the Prometheus response Utf8View handling and skip_wal leader validation in one release-branch fix (#8838) by @evenyag. This is the release-branch umbrella for upstream fixes #8754 and #8823; it is listed here only once.
  • Bump DataFusion to support dictionary literals in Substrait plans (#8842) by @discord9.
  • Harden permission checks and process visibility (#8852) by @shuiyisong.
  • Remove the iceberg.read permission action (#8858) by @shuiyisong.
  • Respect query time zones in timestamp casts (#8859) by @fzlzjerry.
  • Keep deletion markers when compacting part of a window (#8872) by @fengjiachun.
  • Preserve timestamp literal semantics in inserts (#8889) by @killme2008.
  • Restore columnar group-by for dictionary-encoded tags (#8902) by @discord9.
  • Clear pooled Prometheus Remote Write decoder state (#8921) by @shuiyisong.

All Contributors

We would like to thank the following contributors from the GreptimeDB community:

@discord9, @evenyag, @fengjiachun, @fengys1996, @fzlzjerry, @grezzko, @killme2008, @MichaelScofield, @onepizzateam, @shuiyisong, @sunchanglong, @sunng87, @v0y4g3r, @WenyXu

Full Changelog: https://github.com/GreptimeTeam/greptimedb/compare/v1.2.0-beta.1...v1.2.0-beta.2

v1.2.0-beta.1

· 阅读需 12 分钟

Release date: July 31, 2026

GreptimeDB v1.2.0-beta.1 is the first beta of the v1.2 line. It brings the JSON2 type system to maturity, large query performance improvements via dictionary-encoded series keys, Prometheus Remote Write v2 native histogram support, and a large set of correctness and stability fixes.

👍 Highlights

  • JSON2 type system maturity — Variant payloads are now encoded as JSONB instead of serde JSON bytes, with type hints, write-time validation (rejecting non-object values and validating append mode), and a fix for selecting whole JSON2 columns (#8247, #8381, #8434, #8435, #8683).

    CREATE TABLE t (id INT, doc JSON2);
    INSERT INTO t VALUES (1, '{"a": 1, "b": [1, 2]}');
    SELECT doc FROM t; -- returns the full JSON document
  • Faster queries with dictionary-encoded series keys — In-memory primary key columns now use dictionary arrays to alleviate series key expansion, gaining ~24% end-to-end query performance (#8541); dictionary-encoded regex filters also get correct semantics and the fast path back (#8688).

    SELECT * FROM metrics WHERE job = 'node' AND path ~ '/api/.*';
    -- regex filters on dictionary-encoded columns are now semantically correct and fast
  • Security hardening and access control — Local-file SQL access is sandboxed and datanode local-file access is disabled in distributed deployments (#8708 — breaking change, see below and the migration guide); table-level permission checks are enforced across query and write protocols (#8552), database ACL gaps are closed and creators get access to newly created databases (#8492, #8566), restricted HTTP endpoints require authentication (#8672), Postgres now supports SCRAM-SHA-256 (#8304), and an optional dedicated API server port (http.enable_api_server, default false; http.api_server_addr, default 127.0.0.1:4006) exposes only /v1 and the dashboard (#8657).

  • Prometheus Remote Write v2 with native histograms — Support for the Remote Write v2 protocol (#8361), persistence and validation of native histograms (#8382, #8654), and PromQL native histogram functions (#8664). Prometheus sends v1 unless protobuf_message is set; native histogram ingestion is experimental and disabled by default (experimental_enable_prometheus_native_histogram under [http]).

    remote_write:
    - url: http://greptimedb:4000/v1/prometheus/write
    protobuf_message: io.prometheus.write.v2.Request
  • Splunk HEC ingestion — New Splunk HEC-compatible endpoints at /v1/splunk/services/collector/event and /v1/splunk/services/collector/raw, with health probes, gzip support, and pipeline override via the x-greptime-pipeline-name header (#8321, #8491). Vector's splunk_hec_logs sink, the OpenTelemetry Collector splunk_hec exporter, and Fluent Bit can point at GreptimeDB by changing URL and token; when authentication is enabled the token must be formatted as username:password.

  • Cluster lifecycle events — The event recorder now covers table, database, flow, and view DDL events on top of region migration, plus WAL prune, batch GC, and repartition events (#8549, #8623, #8626, #8627, #8632, #8648, #8665, #8673, #8677). Configure with [event_recorder] ttl (default 90 days) and event_types (omitted = record all, [] = disabled); docs: docs#2678.

  • Streaming EXPLAIN ANALYZEPOST /v1/sql/analyze/stream streams per-stage metrics while a distributed query is still running, instead of waiting for completion; slow queries also record metrics on timeout. Enabled by default (http.experimental_enable_explain_analyze_stream, default true) (#8380, #8405, #8584, #8644, #8668).

  • PromQL semantics aligned with Prometheus — Ordinary NaN samples are preserved, or matching handles missing labels and empty operands, range queries align to range tails, and remote read schemas are bound per query (#8494, #8502, #8504, #8650, #8591); promql-parser updated to v0.10 (#8457).

  • Finer control over flush and compaction — Table-level auto_flush_interval with ALTER TABLE SET (#8357, #8403), per-region write buffer limits (#8473), configurable parquet row group size (#8446), ADMIN COMPACT_TABLE with start_time/end_time ranges (#8669), and cancelable flush jobs (#8685).

  • RangeSelect projection pruning — Range queries now prune unused input columns before the RangeSelect plan, reducing scanned columns and I/O (#8570).

    EXPLAIN SELECT ts, value FROM metrics WHERE ts > now() - INTERVAL '1 hour';
    -- only the needed columns are scanned
  • Parallel, resumable export/import v2 — The snapshot-based export/import v2 gained concurrent chunk export (--chunk-parallelism), parallel import tasks (--task-parallelism), and progress reporting (--progress auto|always|never); resume works by re-running the same command, which skips completed chunks and tasks instead of starting over. See the export/import v2 guide.

    greptime cli data export-v2 create \
    --addr 127.0.0.1:4000 \
    --to file:///tmp/greptime-snapshots/demo \
    --chunk-parallelism 4
    # rerun the same command to resume from existing progress
  • Also notable — MySQL as an object store backend (#8560; repartition unsupported on it), Flow scheduling and window-update stability fixes (#8360, #8544, #8582, #8389, #8409, #8611), and repartition polish (#8291, #8497, #8678).

Dashboard

The bundled GreptimeDB dashboard was updated to v0.13.10:

  • Save dashboards as self-contained snapshots (time range, variables, and panel data) that open read-only without querying live data sources (dashboard#627).
  • Result tables support column resizing for easier inspection, including trace queries, with a dedicated table resize mode (dashboard#628, #632, #635, #636).
  • New prominent support menu and refreshed icon/status styling (dashboard#629).
  • PromQL editor fixes (query header, Prometheus plugin sync) and all supported Perses plugins (dashboard#630, #631, #633).
  • Virtual-list logs show a tip for hidden columns; SQL editor executes correctly when the cursor is after a SQL line (dashboard#637, #622).

Breaking changes

🚀 Features

🐛 Bug Fixes

All Contributors

We would like to thank the following contributors from the GreptimeDB community:

@BootstrapperSBL, @MichaelScofield, @QuakeWang, @WenyXu, @ZonaHex, @agrawalx, @discord9, @evenyag, @fengjiachun, @fengys1996, @killme2008, @lyang24, @raphaelroshan, @shuiyisong, @srivtx, @sunchanglong, @sunng87, @v0y4g3r, @waynexia

v1.1.4

· 阅读需 2 分钟

Release date: July 24, 2026

GreptimeDB v1.1.4 is a focused maintenance release improving correctness for streaming Flow expiration and timestamp presentation over MySQL. It also includes stability, query-validation, metadata-client, and storage fixes.

We recommend users on earlier v1.1 releases upgrade to v1.1.4.

👍 Highlights

  • Streaming Flow EXPIRE AFTER values are now converted to the correct time unit, preventing state from expiring too early. Negative values are rejected while 0 remains valid.
  • MySQL timestamp results now respect the column's configured precision, avoiding padded millisecond values and truncated nanosecond values.
  • MetaSrv leader caching is now enabled correctly after leader election, restoring leader-side metadata-cache performance.
  • Compaction scheduling now removes stale status after throttling, so later compaction work can continue normally.

🐛 Bug Fixes

  • fix(query): validate DistAnalyzeExec child count by @discord9 in #8510
  • fix: avoid panic when negating MIN-valued literals by @raphaelroshan in #8484
  • fix: preserve nulls in timestamp arrays by @discord9 in #8508
  • fix: timestamp display precision should respect column schema (#8227) by @divyansh-1009 in #8238
  • fix(mito): chunk manifest object writes by @WenyXu in #8567
  • fix: display codes in metasrv client errors by @evenyag in #8558
  • fix(mito): notify bulk writes on WAL error by @v0y4g3r in #8563
  • fix: ignore dropping marker during GC by @v0y4g3r in #8588
  • fix(query): preserve bare plan names in analyze json by @discord9 in #8519
  • fix(flow): lower routine batching messages to debug by @discord9 in #8592
  • fix(flow): downgrade disabled incremental checkpoint log by @discord9 in #8572
  • fix: demote expected remote dynamic filter misses by @discord9 in #8574
  • fix: prevent credential leaks in sanitize_connection_string by @raphaelroshan in #8539
  • fix(mito2): remove stale compaction status when next compaction is throttled by @v0y4g3r in #8618
  • fix(meta): configure gRPC message limits by @WenyXu in #8616
  • fix(flow): convert streaming expiration to milliseconds by @QuakeWang in #8481
  • fix: qualify scalar-subquery tables in persisted views by @discord9 in #8581
  • fix: preserve leader cache configuration and record cache hits by @WenyXu in #8576

All Contributors

We would like to thank the following contributors from the GreptimeDB community:

@QuakeWang, @WenyXu, @discord9, @divyansh-1009, @evenyag, @raphaelroshan, @v0y4g3r

v1.1.3

· 阅读需 2 分钟

Release date: July 17, 2026

GreptimeDB v1.1.3 is a patch release for the v1.1 line. It improves query correctness, storage stability, and the bundled dashboard.

We recommend users on earlier v1.1 releases upgrade to v1.1.3.

👍 Highlights

  • Scalar-subquery rewrites preserve global ordering for ORDER BY ... DESC LIMIT 1 branches, avoiding a region-local latest row when the branch becomes an intermediate join input.
  • PromQL range and instant selectors can now push cast-based time filters to datanodes for metric tables using TIMESTAMP(6) or TIMESTAMP(9), improving scan pruning.

Dashboard

  • The embedded GreptimeDB dashboard was updated to v0.13.7. Table views are easier to resize and inspect, and the support menu is more prominent.
  • Dashboard snapshots can now capture the current time range, variable values, and panel query results in a self-contained, read-only dashboard that can be saved, exported, and opened without querying live data sources.

🚀 Features

🐛 Bug Fixes

All Contributors

We would like to thank the following contributors from the GreptimeDB community:

@WenyXu, @discord9, @fengjiachun, @sunchanglong, @sunng87, @v0y4g3r

v1.1.2

· 阅读需 3 分钟

Release date: July 02, 2026

GreptimeDB v1.1.2 is a patch release for the v1.1 line. It fixes scheduled Flow runtime semantics, improves slow-query context, and refreshes the bundled dashboards.

We recommend users on v1.1.0 and v1.1.1 upgrade to v1.1.2.

👍 Highlights

Scheduled Flow execution now uses stable logical time. Flows with EVAL INTERVAL now bind now() and current_timestamp() to the scheduled runtime, including distributed plans. This keeps scheduled windows stable instead of depending on when a worker happens to plan the query.

CREATE TABLE flow_input (
ts TIMESTAMP(3) TIME INDEX,
v DOUBLE,
PRIMARY KEY(v)
);

CREATE FLOW flow_eval
SINK TO flow_eval_sink
EVAL INTERVAL '1s'
AS
SELECT
date_bin(INTERVAL '1 second', ts) AS window_start,
count(v) AS value_count,
now() AS scheduled_at
FROM flow_input
WHERE ts >= date_trunc('second', now()) - INTERVAL '1 second'
AND ts < date_trunc('second', current_timestamp())
GROUP BY date_bin(INTERVAL '1 second', ts);

Slow query records include schema context. Slow query entries now carry the schema name for SQL, logical plan, and PromQL slow-query paths. This makes it easier to find which tenant or workload produced a slow query when multiple schemas share a cluster.

USE greptime_private;

SELECT schema_name, cost, threshold, query, timestamp
FROM slow_queries
ORDER BY timestamp DESC
LIMIT 10;

Dashboard

  • Bundled Grafana metrics dashboards were reorganized for cluster and standalone deployments. The update fixes histogram bucket queries and counter-rate normalization, separates latency panels, and collapses flush/compaction sections to make troubleshooting easier.
  • The embedded GreptimeDB dashboard was updated to v0.13.6. This dashboard release refines metric views and fixes SQL execution from the editor when the cursor is after a SQL line.

🚀 Features

🐛 Bug Fixes

⚡ Performance

⚙️ Miscellaneous Tasks

New Contributors

All Contributors

We would like to thank the following contributors from the GreptimeDB community:

@discord9, @evenyag, @fengjiachun, @RitwijParmar, @shuiyisong, @sunchanglong, @v0y4g3r, @WenyXu

v1.1.1

· 阅读需 1 分钟

Release date: June 18, 2026

This release fixes a critical JSON compatibility bug that affects users upgrading from v1.0.x to v1.1.0, where legacy JSONB columns could return incorrect query results or fail during flush. It also removes a lock in the create flow procedure that could self-block sink table creation.

We strongly recommend users on v1.1.0 who use the JSON data type upgrade to v1.1.1.

🐛 Bug Fixes

  • fix: guard structured JSON alignment paths against legacy JSONB columns by @evenyag in #8323
  • fix: remove flow sink table lock by @discord9 in #8317

All Contributors

We would like to thank the following contributors from the GreptimeDB community:

@discord9, @evenyag

v1.1.0

· 阅读需 16 分钟

Release date: June 14, 2026

v1.1.0 adds online partitioning for previously unpartitioned tables, experimental incremental reads for batching flows, the experimental table semantic layer, and new CSV import options, along with performance and stability fixes.

注意

v1.1.0 contains a critical JSON compatibility bug that affects users upgrading from v1.0.x when using the JSON data type. We strongly recommend users on v1.1.0 who use the JSON data type upgrade to v1.1.1 or later.

👍 Highlights

Partition an existing table. Previously only tables created with PARTITION ON COLUMNS could be repartitioned, via SPLIT PARTITION and MERGE PARTITION. v1.1.0 supports partitioning a table that has no partition rules, splitting its single region into multiple partitions with ALTER TABLE ... PARTITION ON COLUMNS:

ALTER TABLE sensor_readings PARTITION ON COLUMNS (device_id, area) (
device_id < 100 AND area < 'South',
device_id < 100 AND area >= 'South',
device_id >= 100 AND area <= 'East',
device_id >= 100 AND area > 'East'
);

The layout can then be adjusted further with SPLIT PARTITION and MERGE PARTITION. Repartitioning requires a distributed cluster with shared object storage and GC enabled.

Experimental incremental read for flows. Batching flows re-execute the full source query on every evaluation. With incremental read enabled, a flow only reads source rows appended since its last run, lowering overhead for large append-only sources. It is disabled by default; enable it in the flownode config:

[flow.batching_mode]
experimental_enable_incremental_read = true

It can also be set per flow with WITH (experimental_enable_incremental_read = 'true'). The source table must be append-only (append_mode = 'true'); otherwise the flow falls back to full-snapshot queries.

Table semantic layer. The experimental table semantic layer lets tables carry greptime.semantic.* metadata, such as signal type, source, metric type, unit, temporality, and ingestion pipeline. GreptimeDB stamps this metadata automatically on supported ingestion paths, and you can also set it manually with CREATE TABLE ... WITH (...). Consumers can query information_schema.table_semantics to understand what each table represents without guessing from table or column names.

MCP Server v0.5.0

GreptimeDB MCP Server v0.5.0 uses table semantic metadata in describe_table, so AI assistants can understand metrics, logs, and traces more directly. It also expands the tool set for SQL, TQL, RANGE queries, pipelines, and dashboards, with stdio/SSE/Streamable HTTP transports, read-only defaults, masking, and audit logging.

Query performance improvements

  • PromQL execution. Range functions such as rate and increase run faster, with benchmarks showing up to 97% lower execution time. Metric joins also improve through TSID-based joins and narrow binary join collection. Overall, compared to v1.0, v1.1 reduces average PromQL query time by 20% to 40%.
  • Scan pruning. Parquet prefiltering, prefilter-result caching, and remote dynamic filters on datanode scans reduce unnecessary row reads. The TSBS cpu-max-all-8 query was 4.5x faster with prefiltering.
  • Read efficiency. Page-index reads and range-cache reuse reduce storage reads for scan-heavy queries. Page-index reads reduced SST bytes fetched by 93.2% on one workload.

Dashboard

  • The built-in Perses dashboard now supports trace visualization: a trace list and a per-trace detail/Gantt view from the trace table, using the GreptimeDB Perses data-source plugin.

CSV import options

COPY FROM adds SKIP_BAD_RECORDS = 'true' for skipping invalid rows and HEADERS = 'false' for importing headerless CSV files:

COPY tbl FROM '/path/to/file.csv' WITH (
FORMAT = 'csv',
SKIP_BAD_RECORDS = 'true',
HEADERS = 'false'
);

Breaking changes

🚀 Features

🐛 Bug Fixes

🚜 Refactor

📚 Documentation

⚡ Performance

  • perf: optimize extrapolated rate op family by @waynexia in #7880
  • perf: join metrics tables on the tsid key whenever possible by @waynexia in #7927
  • perf(mito-codec): optimize SparseValues decode and lookup by @evenyag in #8057
  • perf(mito): split record batches on equal timestamps by @evenyag in #8163
  • perf: collect narrow binary join by @waynexia in #8193
  • perf: read primary key as binary if it overflows the dictionary by @evenyag in #8187
  • perf(mito): cached-size single-pass WAL entry encoder by @lyang24 in #8254

🧪 Testing

⚙️ Miscellaneous Tasks

RFC

New Contributors

All Contributors

We would like to thank the following contributors from the GreptimeDB community:

@Copilot, @daviderli614, @Detachm, @discord9, @evenyag, @fengjiachun, @fengys1996, @killme2008, @kimjune01, @lyang24, @MichaelScofield, @onepizzateam, @QuakeWang, @rogierlommers, @shuiyisong, @sunng87, @v0y4g3r, @waynexia, @WenyXu, @yihong0618, @ZonaHex

v1.0.2

· 阅读需 2 分钟

Release date: May 14, 2026

This release fixes a bug where a query could return incorrect rows when all of the following were true:

  • the table uses merge mode (merge_mode);
  • the range result cache is enabled;
  • the query filters the time index column with OR (e.g. WHERE ts = a OR ts = b).

In this case the cache could reuse a previous query's result and return rows that should have been filtered out. This is now fixed. (#8105)

This release also improves performance for PromQL queries on tables whose time index uses a non-millisecond precision (e.g. Timestamp(ns) or Timestamp(us)). Previously the time-range filter could not be pushed down to storage in this case, so bounded PromQL queries fell back to scanning all SST files instead of pruning by time range. (#7926)

We recommend users on v1.0.0 and v1.0.1 upgrade to v1.0.2.

🚀 Features

🐛 Bug Fixes

  • fix: window sort off by one precision TimeRange&better alias track by @discord9 in #8019
  • fix(server): describe EXPLAIN statements so bind parameters work by @BootstrapperSBL in #8035
  • fix: windows windowed sort ci by @discord9 in #8039
  • fix: batched prometheus ingest row metric by @v0y4g3r in #8054
  • fix: preserve case in database name from connection string by @v0y4g3r in #8062
  • fix(metric-engine): validate column types and require time index in verify_rows by @BootstrapperSBL in #8018
  • fix: type inference for sql rewrite by @sunng87 in #8052
  • fix: infer time index from column meta on derived table by @waynexia in #8013
  • fix(mito): ignore compaction override in enum option validation by @QuakeWang in #8094
  • fix(mito2): drop unsound time-filter cache-key stripping by @evenyag in #8105
  • fix: remap batch table route addresses by @WenyXu in #8109
  • fix: avoid stale route update during repartition allocation by @WenyXu in #8115

New Contributors

All Contributors

We would like to thank the following contributors from the GreptimeDB community:

@BootstrapperSBL, @QuakeWang, @WenyXu, @discord9, @evenyag, @sunng87, @v0y4g3r, @waynexia

v1.0.1

· 阅读需 3 分钟

Release date: April 23, 2026

This version brings a set of stability improvements, bug fixes, and performance optimizations, with notable updates in compaction, staging coordination, lease handling, and query execution.

If you are using v1.0.0 , we recommend upgrading to v1.0.1.

🚀 Features

  • feat(mito2): allow CompactionOutput to succeed independently by @v0y4g3r in #7948
  • feat: propagate staging leader through lease and heartbeat by @WenyXu in #7950
  • feat: cancel local compaction for enter staging by @WenyXu in #7885
  • feat: use PreFilterMode::All if only one source in the partition range by @evenyag in #7973
  • feat: add an index page by @sunng87 in #7975

🐛 Bug Fixes

  • fix: remap peer addresses during retries by @WenyXu in #7933
  • fix: using uint64 datatype for postgres prepared statement parameters by @sunng87 in #7942
  • fix: fix current version comparison logic for pre-releases by @daviderli614 in #7946
  • fix(index): intersect bitmaps before early exit in predicates applier by @cuiweixie in #7867
  • fix: randomize standalone test ports in cli export test by @v0y4g3r in #7955
  • fix: match term zh by @discord9 in #7952
  • fix: cargo check -p common-meta by @fengys1996 in #7964
  • fix: always skip field pruning when using merge mode by @evenyag in #7957
  • fix: mysql prepare correctly returns error instead of panic by @MichaelScofield in #7963
  • fix: relax azblob validation requirements by @WenyXu in #7970
  • fix(meta): renew operating region leases from keeper roles by @WenyXu in #7971
  • fix: remove redundant error messages in admin functions by @yxrxy in #7953
  • fix: allow ipv4_num_to_string to accept valid integers by @JoeS51 in #7994
  • fix: update manifest state before deleting delta files by @evenyag in #8001
  • fix: upgrade mysql metadata value limit to mediumblob by @WenyXu in #7985
  • fix: zh same underscore behavior by @discord9 in #8002
  • fix: manifest recovery scans after last version if possible by @evenyag in #8009

🚜 Refactor

  • refactor: move group rollback ownership to parent repartition by @WenyXu in #7967

⚡ Performance

⚙️ Miscellaneous Tasks

New Contributors

All Contributors

We would like to thank the following contributors from the GreptimeDB community:

@JoeS51, @MichaelScofield, @QuakeWang, @WenyXu, @ZonaHex, @cuiweixie, @daviderli614, @discord9, @evenyag, @fengjiachun, @fengys1996, @killme2008, @lyang24, @shuiyisong, @sunng87, @v0y4g3r, @waynexia, @yxrxy

v1.0.0

· 阅读需 7 分钟

Release date: April 08, 2026

This is GreptimeDB v1.0.0 — our first GA release! We couldn't have gotten here without the community. Thank you to everyone who filed issues, submitted PRs, and ran GreptimeDB in your environments. Your feedback helped us improve every step of the way. This is a big milestone, and we'll continue making GreptimeDB better.

GreptimeDB v1.0.0 switches the default SST format to flat for better performance under high-cardinality workloads, improves metric engine ingestion with bulk inserts, adds partial success support for trace ingestion, introduces built-in Perses dashboard support, and includes several PostgreSQL compatibility fixes.

👍 Highlights

Flat SST is now the default storage format. New tables use the flat format by default. Existing tables using primary_key format continue to work, and the flat scan path supports both formats. To explicitly use the old format:

ALTER TABLE my_table SET 'sst_format' = 'primary_key';

Or via HTTP ingestion header:

x-greptime-hints: sst_format=primary_key

OTLP

  • Partial success in trace ingestion so partial errors no longer fail the entire batch.
  • Auto alter table during trace ingestion from int to float types.

Dashboard

  • Built-in Perses dashboard support. GreptimeDB now ships with built-in visualization powered by Perses.
  • Dashboard updated to v0.12.0.

PostgreSQL Compatibility

  • Fix extended query optimization and format issues.
  • Fix ParameterDescription size limit handling.
  • Fix 8-bit int mapped to smallint.
  • Fix sync cleanup issues with PostgreSQL format.

Breaking changes

  • feat!: switch default sst format to flat by @evenyag in #7909
  • refactor!: update arrow-ipc output to stream format by @sunng87 in #7922

🚀 Features

  • feat(procedure): detect potential deadlock when parent/child procedures share lock keys by @YZL0v3ZZ in #7752
  • feat: introduce APIs for storing perses dashboard definition by @sunng87 in #7791
  • feat: track unlimited usage in memory manager by @fengjiachun in #7811
  • feat(http): improve error logging with client IP by @maximk777 in #7503
  • feat(mito2): add partition range cache infrastructure by @evenyag in #7798
  • feat: add flat last row reader to the final stream by @evenyag in #7818
  • feat(metric-engine): support bulk inserts with put fallback by @v0y4g3r in #7792
  • feat: update dashboard to v0.12.0 by @ZonaHex in #7823
  • feat: cache decoded region metadata alone with parquet metadata by @waynexia in #7813
  • feat: export import v2 pr1 by @fengjiachun in #7785
  • feat(mito): flat scan for time series memtable by @v0y4g3r in #7814
  • feat: avoid some vector-array conversions on flat projection by @waynexia in #7804
  • feat: supports sst_format for x-greptime-hints and database options by @killme2008 in #7843
  • feat: add parquet pk prefilter helpers by @evenyag in #7850
  • feat: implement partition range cache stream by @evenyag in #7842
  • feat: use ArrowReaderBuilder instead of the RowGroups API by @evenyag in #7853
  • feat: simplify nested aggr inside count query by @waynexia in #7859
  • feat: update postgres ParameterDescription size limit by @sunng87 in #7861
  • feat: add incremental read context and scan boundaries by @discord9 in #7848
  • feat: add common_version customization by @sunng87 in #7869
  • feat: pending rows batching for metrics by @v0y4g3r in #7831
  • feat(partition): add expression split utility by @WenyXu in #7822
  • feat: implement prefilter framework and primary key prefilter by @evenyag in #7862
  • feat: implement export-v2 chunked data export flow by @fengjiachun in #7841
  • feat: auto-align Prometheus schemas in pending rows batching by @v0y4g3r in #7877
  • feat: implement prefilter for bulk memtable by @evenyag in #7895
  • feat: partial success in trace ingestion by @shuiyisong in #7892
  • feat: always use flat scan path for both format by @evenyag in #7901
  • feat: auto alter table during trace ingestion from int to float by @shuiyisong in #7871

🐛 Bug Fixes

🚜 Refactor

📚 Documentation

⚡ Performance

🧪 Testing

  • test(fuzz): add metric table repartition fuzz target by @WenyXu in #7754
  • test: filter on region_peers table by @waynexia in #7864

⚙️ Miscellaneous Tasks

New Contributors

All Contributors

We would like to thank the following contributors from the GreptimeDB community:

@Boudewijn26, @MichaelScofield, @WenyXu, @YZL0v3ZZ, @ZonaHex, @cuiweixie, @daviderli614, @discord9, @evenyag, @fengjiachun, @fengys1996, @github-actions[bot], @killme2008, @maximk777, @shuiyisong, @sunng87, @v0y4g3r, @waynexia, @yihong0618, @ynachi