Perses
Perses 是 CNCF 旗下的可观测性仪表盘项目。你可以通过两个官方数据源插件将 Perses 连接到 GreptimeDB:
- GreptimeDB 数据源 — 对 metrics、logs、traces 表执行 SQL 查询
- Prometheus 数据源 — 通过 GreptimeDB 的 Prometheus 兼容 API 执行 PromQL 查询
GreptimeDB 插件 已纳入 CNCF Perses 官方插件仓库。两个插件配合使用,可在 GreptimeDB 统一存储之上构建可观测性大盘。统一数据模型见 为什么选择 GreptimeDB。
GreptimeDB 内置控制台 也嵌入了 Perses(Visualization 菜单)。打开 http://localhost:4000/dashboard,点击 Visualization,即可使用下文相同的数据源插件。你也可以在独立 Perses 部署中配置 GreptimeDB。
支持的查询类型
| 查询类型 | 数据源插件 | 查询插件 | 面板类型 |
|---|---|---|---|
| PromQL | PrometheusDatasource | PrometheusTimeSeriesQuery | TimeSeriesChart、GaugeChart、StatChart |
| SQL 时序 | GreptimeDBDatasource | GreptimeDBTimeSeriesQuery | TimeSeriesChart、StatChart、Table |
| Logs | GreptimeDBDatasource | GreptimeDBLogQuery | LogsTable |
| Traces | GreptimeDBDatasource | GreptimeDBTraceQuery | TraceTable、TracingGanttChart |
标准 metrics 大盘使用 PromQL;logs、traces 和使用 RANGE、ALIGN、FILL 的 SQL 时序查询使用 GreptimeDB 数据源。
前置条件
- 已运行的 GreptimeDB 实例。见 GreptimeDB 单机版 或 GreptimeDB 集群。确保 Perses 可以访问 GreptimeDB 的 HTTP API。
- 已运行的 Perses 实例。较新版本的 Perses 已内置 GreptimeDB 和 Prometheus 数据源插件。
选择数据源
| 场景 | Perses 插件 | GreptimeDB 端点 |
|---|---|---|
Prometheus 指标、node_exporter、现有 PromQL 大盘 | PrometheusDatasource | http://<host>:4000/v1/prometheus |
日志表、trace 表、SQL 时序(RANGE、ALIGN) | GreptimeDBDatasource | http://<host>:4000 |
标准 metrics 大盘使用 PromQL;logs、traces 和高级 SQL 聚合使用 GreptimeDB 数据源。
GreptimeDB 数据源插件
GreptimeDB 数据源插件通过 HTTP 向 GreptimeDB 发送 SQL 查询。
Connection 配置
在 Perses 中进入 Settings → Datasources → Add。选择 GreptimeDB Datasource 插件,将 Access Type 设为 Direct access,填写 URL:
http://<host>:4000
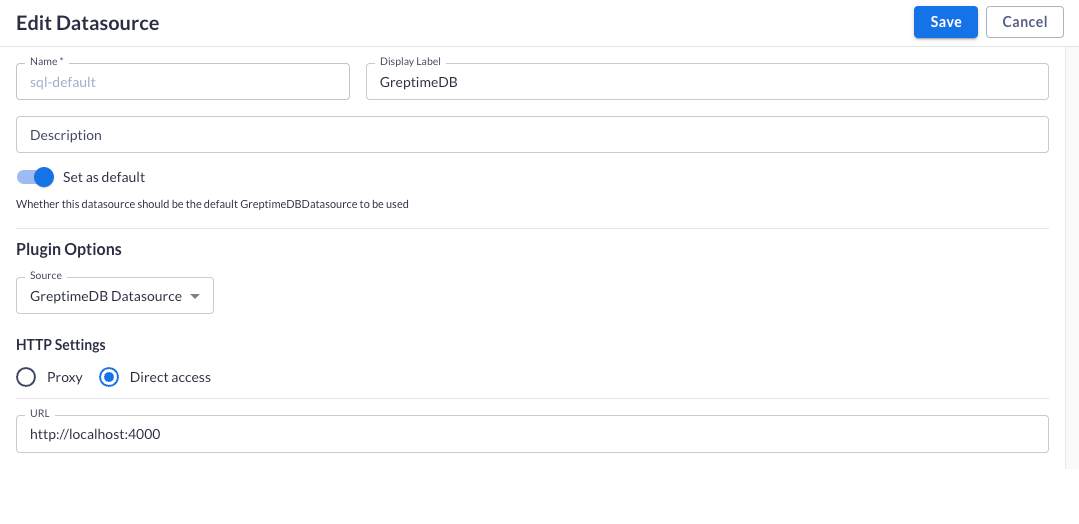
点击 Save 保存数据源。
Metrics 查询(SQL)
添加 Time Series Chart 类型面板。在 Query 标签页选择 GreptimeDB Time Series Query 和 GreptimeDB 数据源。
用 ${__from} 和 ${__to} 对接仪表盘时间范围。这两个变量为毫秒级时间戳,配合 to_timestamp_millis() 使用:
SELECT
  date_bin(INTERVAL '1 minute', "ts") AS "time",
  "host",
  avg("cpu_usage") AS "value"
FROM public."cpu_metrics_30"
WHERE "ts" >= to_timestamp_millis(${__from})
  AND "ts" <= to_timestamp_millis(${__to})
GROUP BY "time", "host"
ORDER BY "time" ASC, "host" ASC;
点击 Run Query 预览图表,再点击 Apply 保存面板。

查询语法见 SQL。
Logs 查询
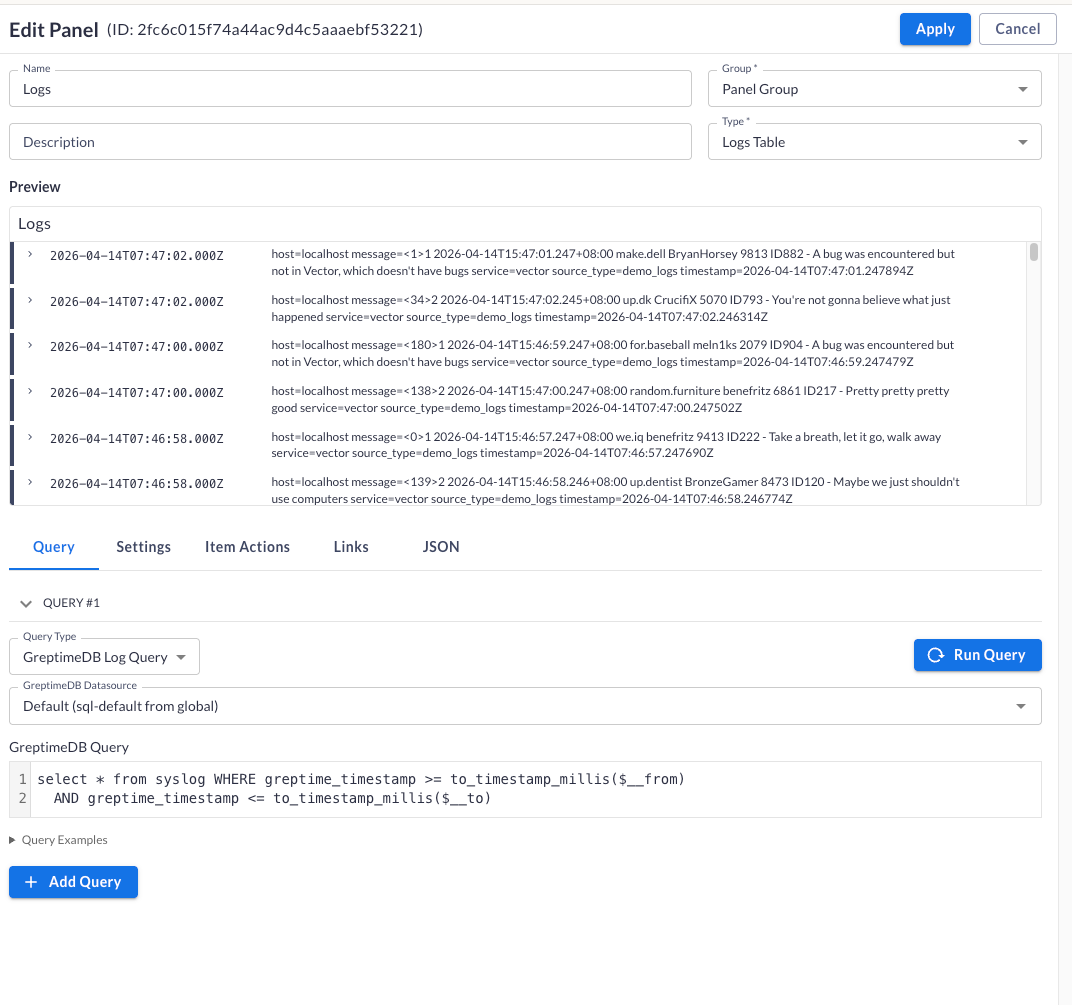
添加 Logs Table 类型面板。在 Query 标签页选择 GreptimeDB Log Query 和 GreptimeDB 数据源。
编写针对日志表的 SQL 查询。用 ${__from} 和 ${__to} 按仪表盘时间范围过滤:
SELECT * FROM syslog
WHERE greptime_timestamp >= to_timestamp_millis(${__from})
  AND greptime_timestamp <= to_timestamp_millis(${__to})
点击 Run Query 预览日志,再点击 Apply 保存面板。
Traces
trace 搜索与 Gantt 视图建议在 GreptimeDB 控制台 的 Traces Query 中使用,无需额外配置。
Prometheus 数据源插件
Prometheus 数据源插件通过 GreptimeDB 的 Prometheus 兼容 HTTP API 查询 metrics。
Connection 配置
在 Perses 中进入 Settings → Datasources → Add。选择 Prometheus 插件,将 Access Type 设为 Direct access,填写 URL:
http://<host>:4000/v1/prometheus
点击 Save 保存数据源。
PromQL 查询
使用 PrometheusTimeSeriesQuery,配合 TimeSeriesChart、GaugeChart 或 StatChart 等面板。
node_cpu_seconds_total{mode="idle"}
查询语法见 PromQL。
迁移 Grafana 仪表盘
GreptimeDB 兼容 Prometheus 生态。可用 Perses 迁移工具 导入现有 Grafana 仪表盘。迁移后,将 PromQL 面板映射到指向 GreptimeDB 的 Prometheus 数据源。Node Exporter 等大盘的变量、Gauge 和折线图通常无需修改查询语句。
下一步
- Grafana 集成 — 将 Grafana 连接到 GreptimeDB
- GreptimeDB 控制台 — 内置查询 UI,内嵌 Perses
- 为什么选择 GreptimeDB — 统一可观测性存储