Prometheus
在本节中,我们将收集系统层面的数据,例如 CPU 和内存使用情况,并将它们发送到本地 GreptimeDB。
写入数据
配置
我们使用 Prometheus node_exporter 作为收集数据的示例。 首先创建一个名为 prometheus.yml 的文件,将以下配置复制到其中。
global:
  scrape_interval: 10s # The default is every 1 minute.
  evaluation_interval: 10s # The default is every 1 minute.
  # scrape_timeout is set to the global default (10s).

scrape_configs:
  # The job name is added as a label `job=<job_name>` to any timeseries scraped from this config.
  - job_name: "node"
    static_configs:
      - targets: ["node_exporter:9100"]

remote_write:
- url: http://greptimedb:4000/v1/prometheus/write?db=publicglobal:
scrape_interval: 10s # The default is every 1 minute.
evaluation_interval: 10s # The default is every 1 minute.
# scrape_timeout is set to the global default (10s).
scrape_configs:
# The job name is added as a label `job=<job_name>` to any timeseries scraped from this config.
- job_name: "node"
static_configs:
- targets: ["node_exporter:9100"]
remote_write:
- url: http://greptimedb:4000/v1/prometheus/write?db=public配置中将 remote_write 的 URL 设置为 GreptimeDB 的 URL,并将收集指标的间隔设置为 10 秒。URL 中的 greptimedb 是 Docker 网络中 GreptimeDB 的服务名。
启动服务
我们使用 Docker Compose 启动 GreptimeDB、Prometheues、node_exporter 和 Grafana。首先创建一个名为 docker-compose.yml 的文件,将以下内容复制到其中:
services:
  grafana:
    image: grafana/grafana-oss:9.5.15
    container_name: grafana
    ports:
      - 127.0.0.1:3000:3000

  greptime:
    image: greptime/greptimedb:v0.9.0
    container_name: greptimedb
    ports:
      - 127.0.0.1:4000:4000
      - 127.0.0.1:4001:4001
      - 127.0.0.1:4002:4002
      - 127.0.0.1:4003:4003
    command: "standalone start --http-addr 0.0.0.0:4000 --rpc-addr 0.0.0.0:4001 --mysql-addr 0.0.0.0:4002 --postgres-addr 0.0.0.0:4003"
    volumes:
      - ./greptimedb:/tmp/greptimedb

  prometheus:
    image: prom/prometheus:v2.52.0
    container_name: prometheus
    depends_on:
      - node_exporter
    ports:
      - 127.0.0.1:9090:9090
    volumes:
      - ./prometheus.yml:/etc/prometheus/prometheus.yml:ro

  node_exporter:
    image: quay.io/prometheus/node-exporter:v1.8.0
    container_name: node_exporter_local
    ports:
      - 127.0.0.1:9100:9100
    command:
      - '--path.rootfs=/'

networks: {}services:
grafana:
image: grafana/grafana-oss:9.5.15
container_name: grafana
ports:
- 127.0.0.1:3000:3000
greptime:
image: greptime/greptimedb:v0.9.0
container_name: greptimedb
ports:
- 127.0.0.1:4000:4000
- 127.0.0.1:4001:4001
- 127.0.0.1:4002:4002
- 127.0.0.1:4003:4003
command: "standalone start --http-addr 0.0.0.0:4000 --rpc-addr 0.0.0.0:4001 --mysql-addr 0.0.0.0:4002 --postgres-addr 0.0.0.0:4003"
volumes:
- ./greptimedb:/tmp/greptimedb
prometheus:
image: prom/prometheus:v2.52.0
container_name: prometheus
depends_on:
- node_exporter
ports:
- 127.0.0.1:9090:9090
volumes:
- ./prometheus.yml:/etc/prometheus/prometheus.yml:ro
node_exporter:
image: quay.io/prometheus/node-exporter:v1.8.0
container_name: node_exporter_local
ports:
- 127.0.0.1:9100:9100
command:
- '--path.rootfs=/'
networks: {}然后执行以下命令:
docker-compose updocker-compose up当所有服务成功启动后,主机指标将被收集并发送到 GreptimeDB。
使用 Grafana 可视化数据
添加数据源
你可以在 http://localhost:3000 访问 Grafana 并使用 admin 作为用户名和密码登录。
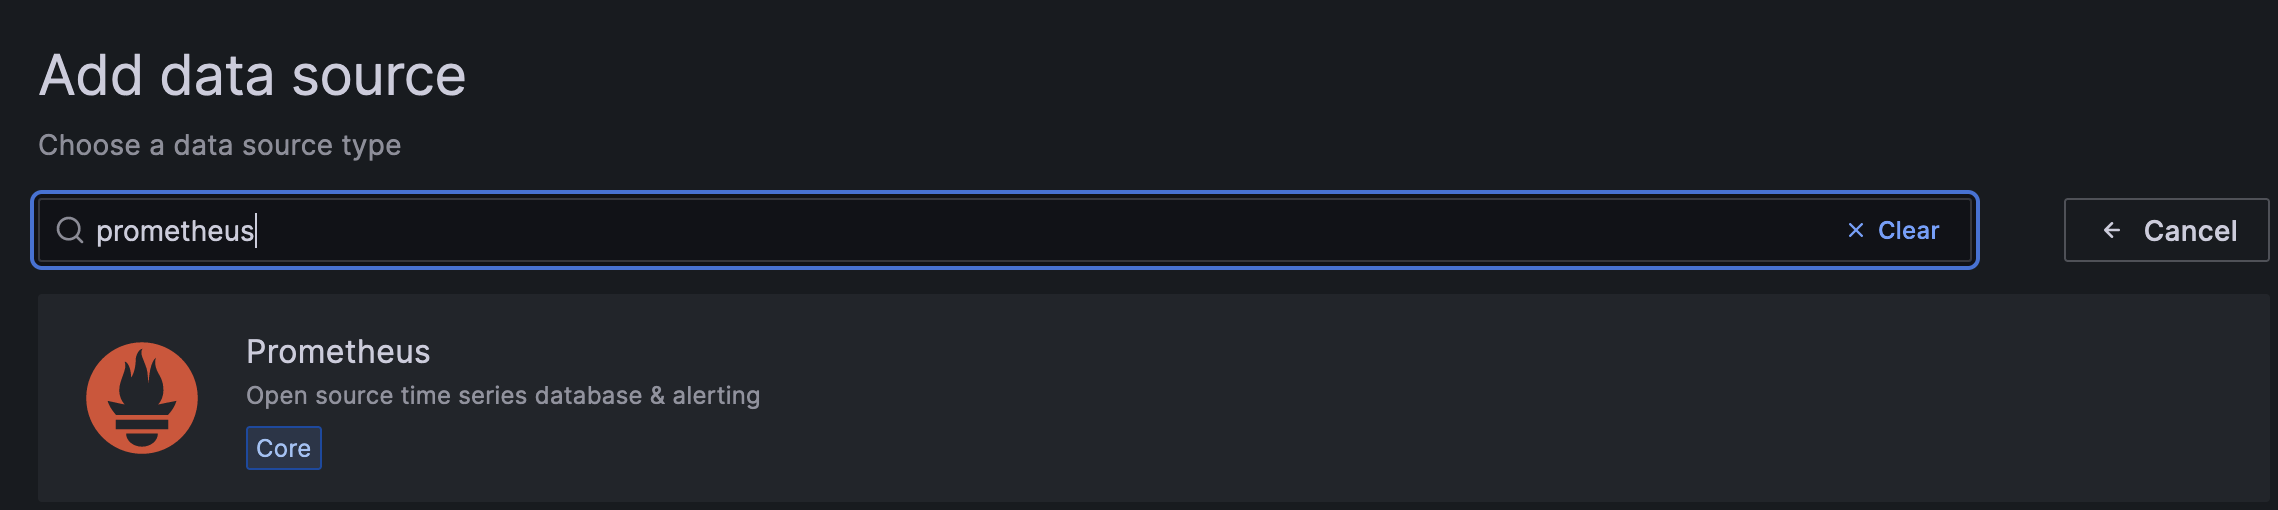
GreptimeDB 可以作为 Prometheus 数据源配置在 Grafana 中。 点击 Add data source 按钮,选择 Prometheus 作为类型。
填写以下信息:
- Name:
GreptimeDB - Prometheus server URL in HTTP:
http://greptimedb:4000/v1/prometheus - Custom HTTP headers: 点击 Add header, 填写 header
x-greptime-db-name和 valuepublic,即数据库的名称。
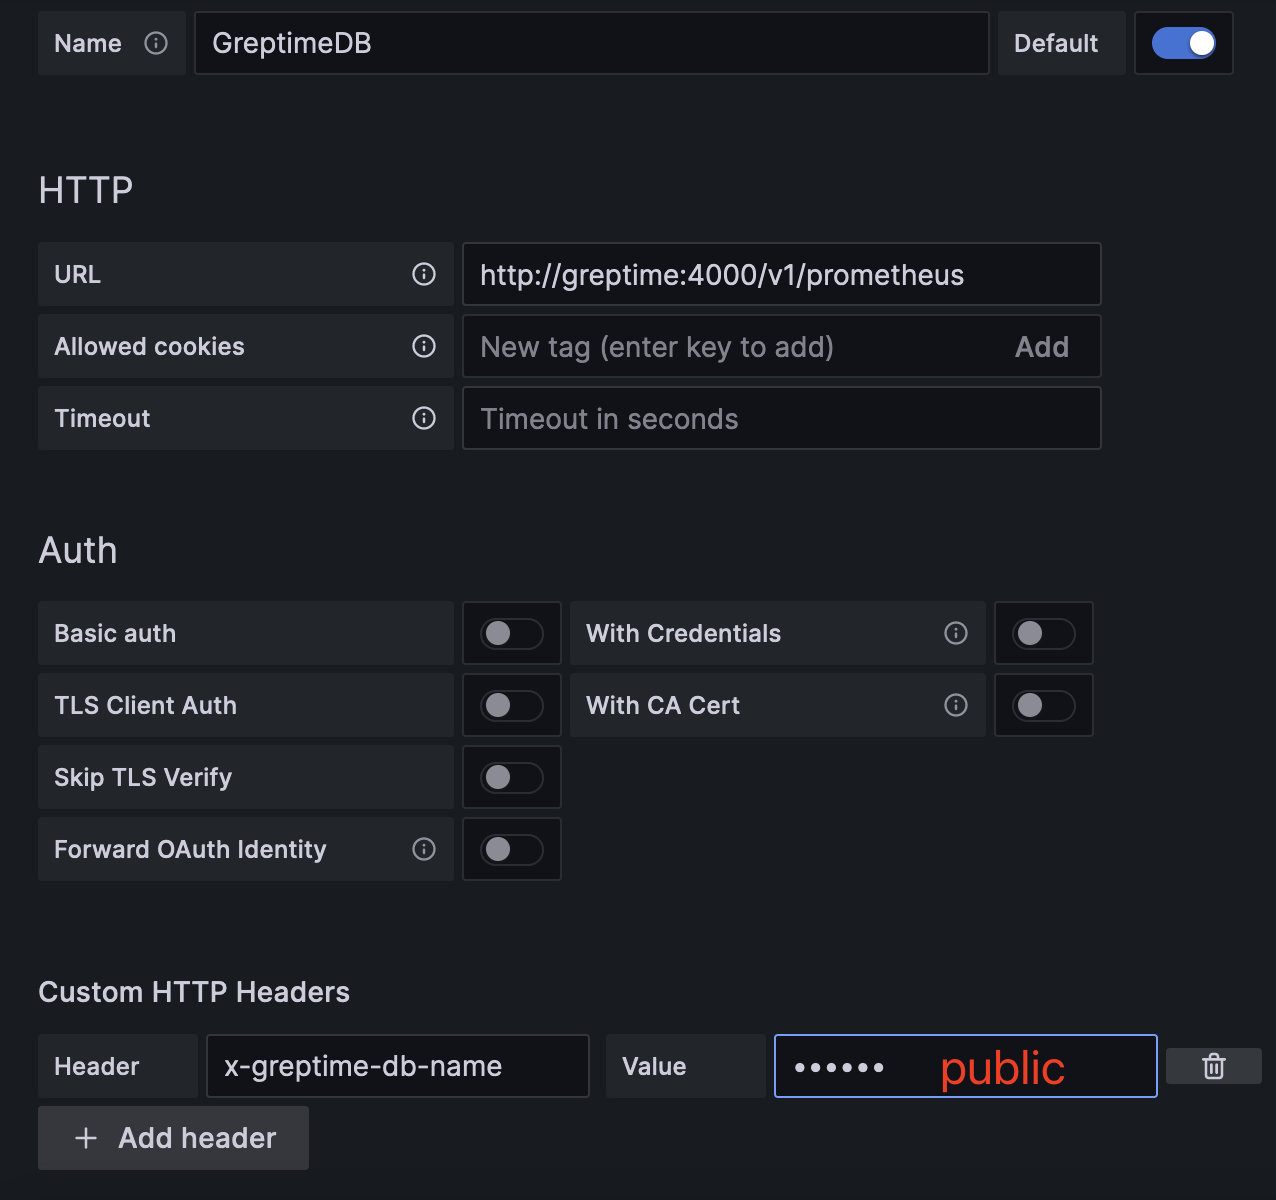
点击 Save & Test 按钮,确保数据源配置成功。
关于使用 Prometheus 作为 GreptimeDB 数据源的更多信息,请参考 Grafana-Prometheus。
创建仪表盘
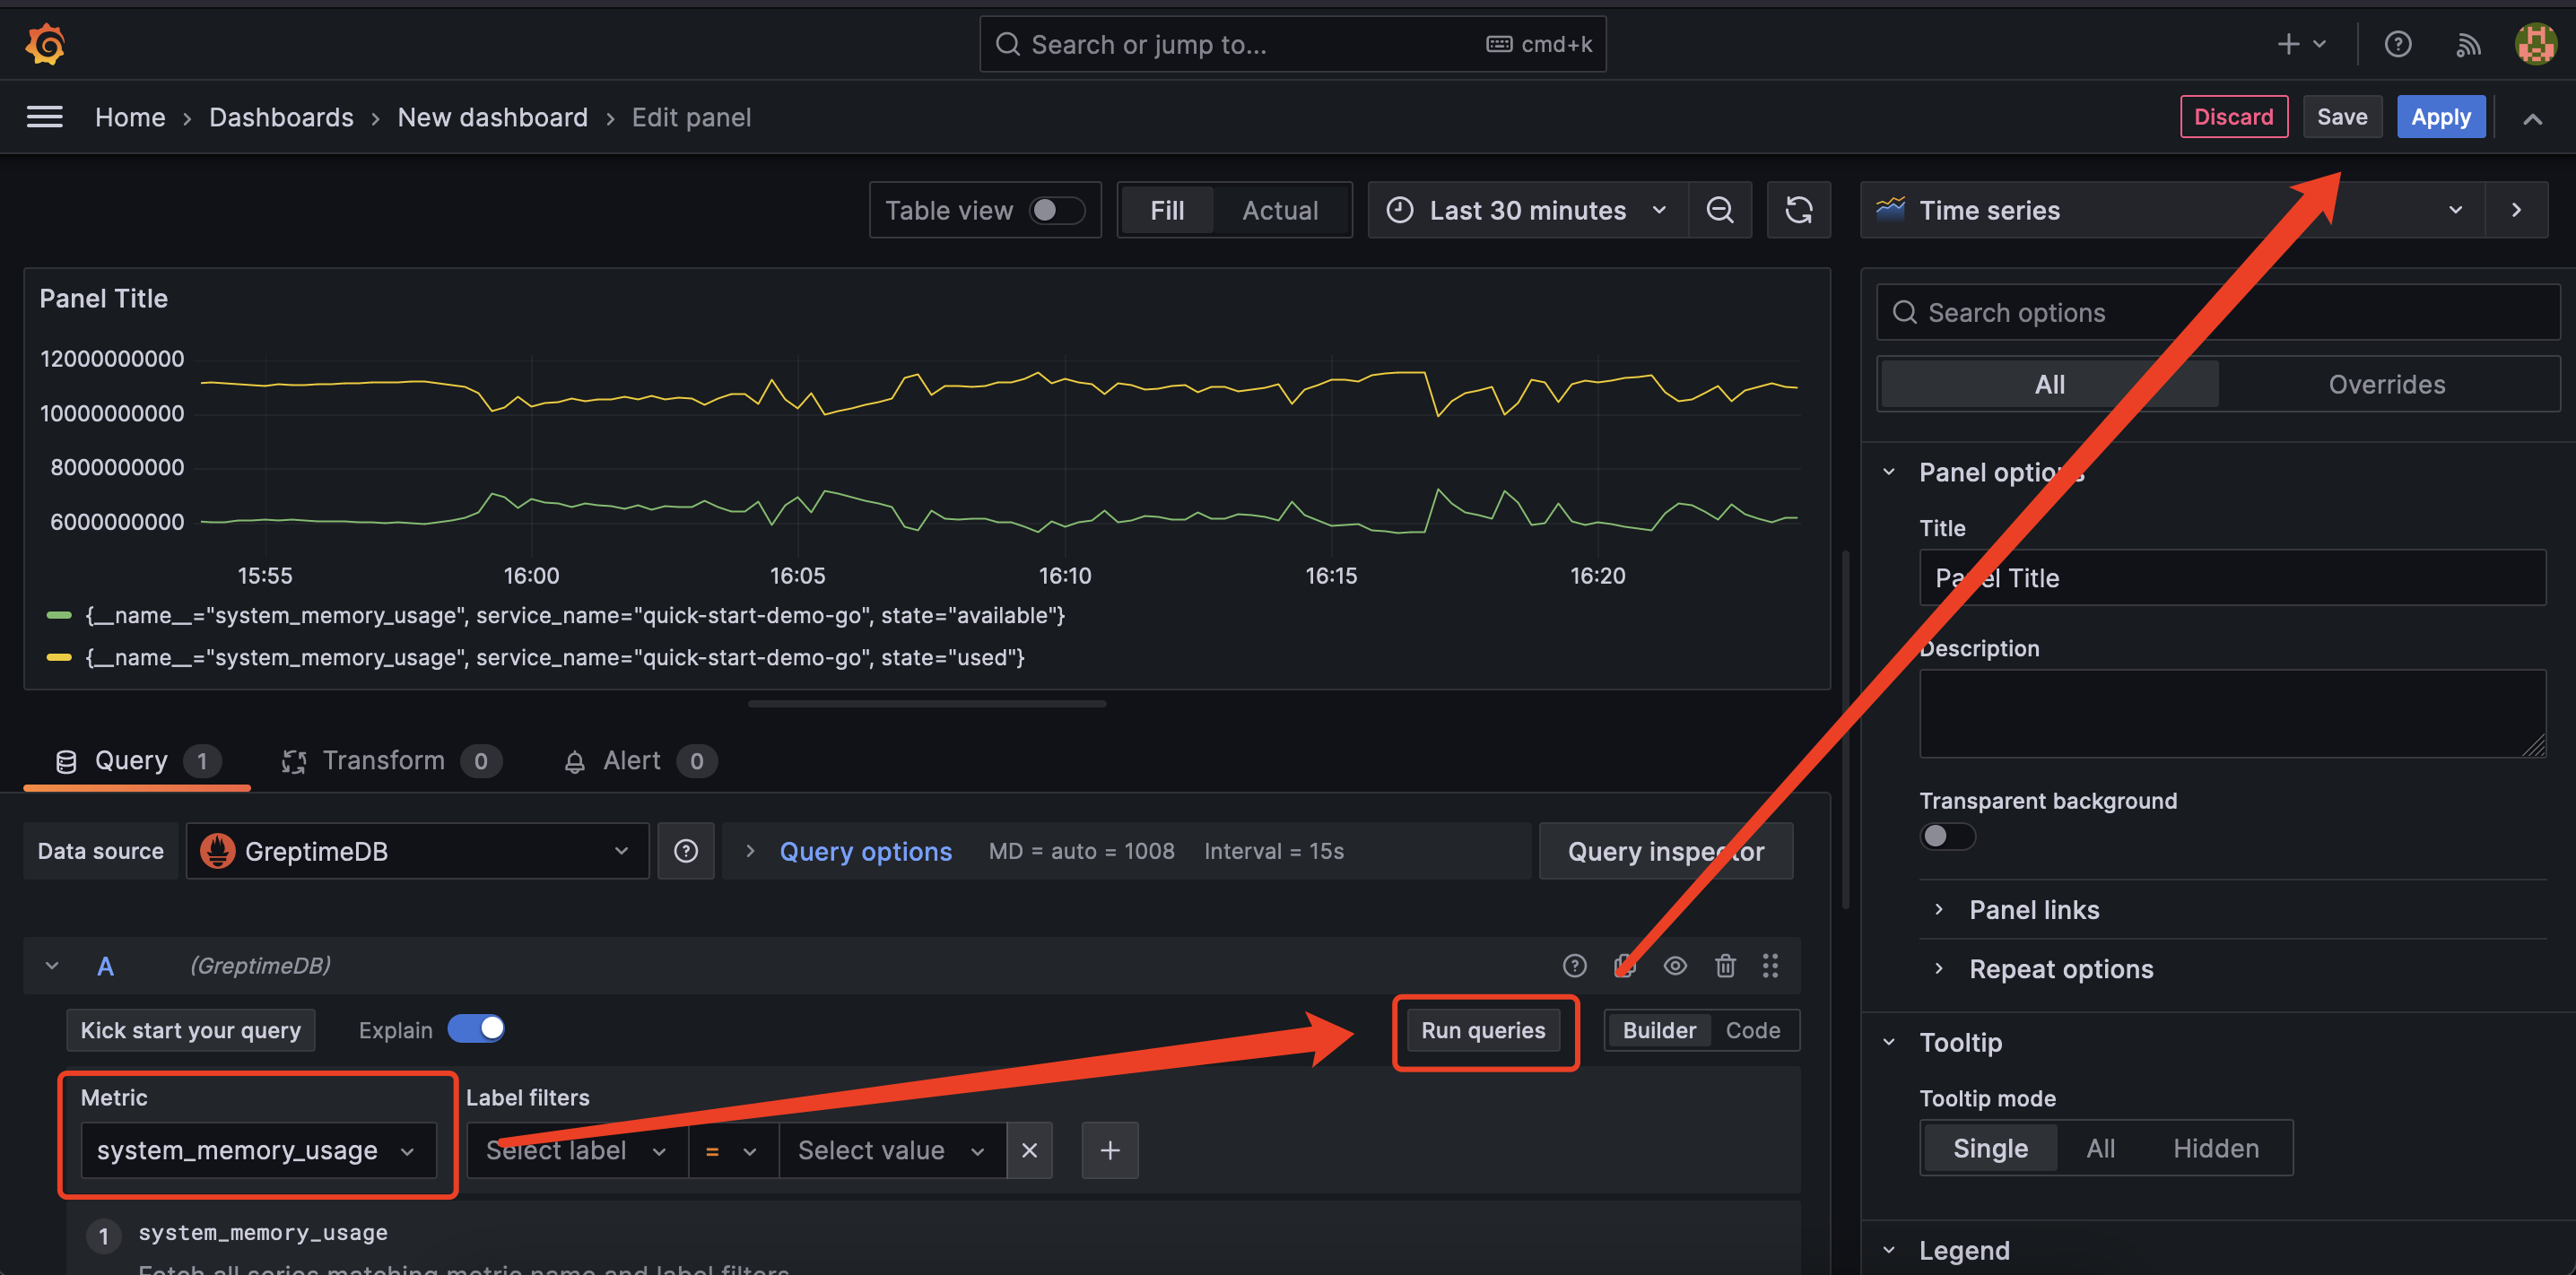
在 Grafana 中创建一个新的仪表盘,点击 Create your first dashboard 按钮。 然后,点击 Add visualization,选择 GreptimeDB 作为数据源。
在 Metric 下拉列表中选择一个指标,然后点击 Run query 查看指标数据。 当你查看数据并确认无误后,点击 Save 保存面板。
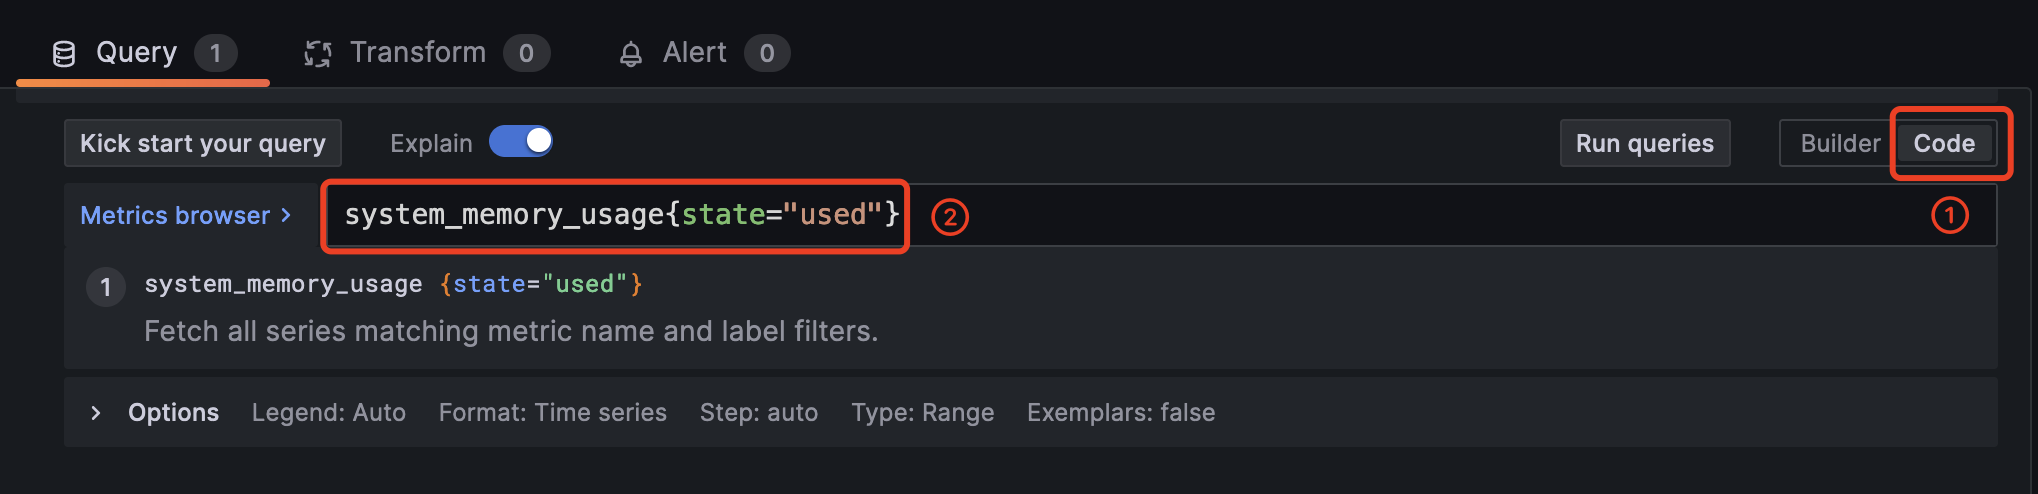
你还可以使用 PromQL 创建面板。 点击 Query 标签页右侧的 code 按钮,切换到 PromQL 编辑器。 然后输入一个 PromQL 语句,例如 system_memory_usage{state="used"},点击 Run query 查看指标数据。
注意
GreptimeDB 兼容大部分 PromQL,但是有一些限制。请参考 PromQL 限制 文档获取更多信息。
下一步
恭喜你已经快速体验了 GreptimeDB 的基础功能! 现在,你可以通过访问 用户指南文档 来探索更多 GreptimeDB 的功能。